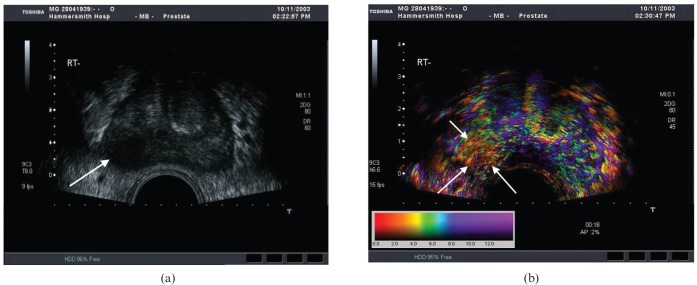
Figure 14.
Functional imaging of the prostate. (a) Axial B-mode ultrasound depicting a carcinoma (arrow). (b) Corresponding section of prostate with a functional overlay image (Toshiba, Tokyo, Japan) superimposed showing contrast medium bolus arrival time following an intravenous injection of microbubbles. The cancer (arrows) demonstrates an earlier arrival time than the rest of the prostate. The colour scale shows the arrival time in seconds. Reproduced with permission from [44].

