
Figure 1.
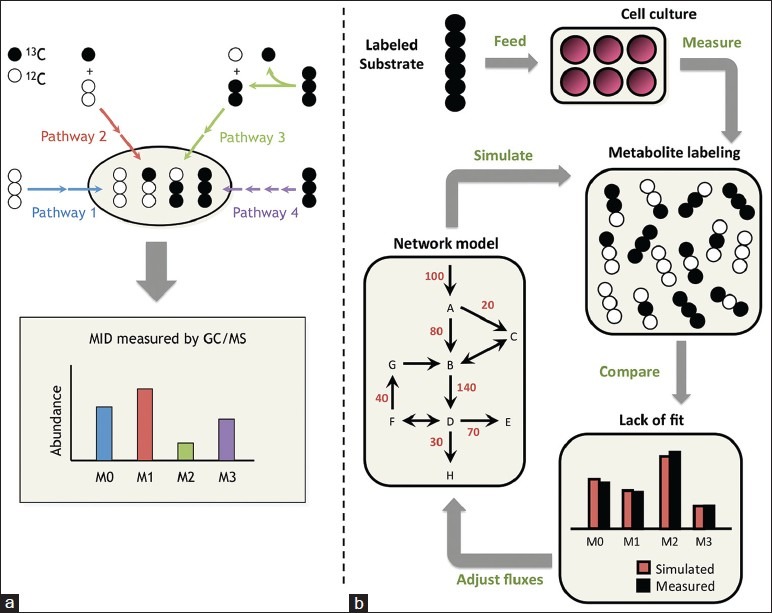
Isotope tracing and13C-metabolic flux analysis. (a) In simple metabolic networks, each pathway produces a unique labeling pattern in the final product, and the resulting mass isotopomer distribution provides a direct measure of relative flux in the network. Mass isotopomers are molecules with the same chemical formula but different molecular weights due to varying incorporation of heavy isotopes. They are denoted M0, M1, M2, etc., in order of increasing weight. (b) In complex networks, a computational model is applied to determine fluxes by minimizing the lack of fit between simulated and measured labeling patterns at multiple pathway nodes. The flux parameters in the model are iteratively adjusted until the optimization converges