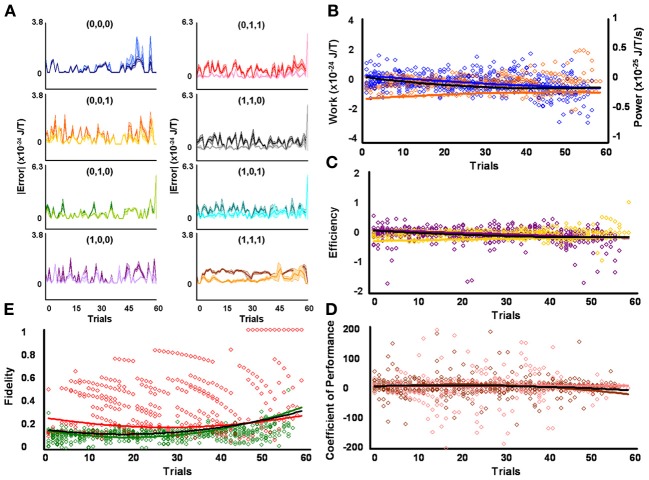
Figure 5.
Initial medium responders learn to diagnose and correct classical errors in executed reversal strategies signaling mating fitness. (A) Repetition coding prevented errors in executed serial reversal signals from exceeding estimated single bit-flip errors in absolute mean average Boltzmann entropy [executed (light blue) and bit-flipped (dark blue) strategy (0,0,0), executed (light orange) and bit-flipped (dark orange) strategy (0,0,1), executed (lime green) and bit-flipped (green) strategy (0,1,0), executed (lavender) and bit-flipped (purple) strategy (1,0,0), executed (pink) and bit-flipped (red) strategy (0,1,1), executed (gray) and bit-flipped (black) strategy (1,1,0), executed (turquoise) and bit-flipped (teal) strategy (1,0,1), executed (gold) and bit-flipped (brown) strategy (1,1,1)]. (B) Differences in mean average Boltzmann entropy between strategy planning and execution stages were expelled by ciliates when learning to detect and correct errors in modal (orange) and non-modal (blue) serial reversal signals. Negative trends in work and associated power functions show that serial strategies underwent refrigeration cycles of increasingly greater magnitude to maintain constant entropy levels. (C,D) Trends in mean average efficiencies and coefficients of performance for modal (gold and pink, respectively) and non-modal (purple and brown, respectively) serial reversal signals corresponded with work and power functions, confirming ciliates behave like Szilárd engines employing refrigeration cycles when necessary to correct signaling strategy errors. (E) Higher trends in the mean average fidelity of Boltzmann entropy between strategy planning and execution stages indicate repetition coding was more successful in protecting modal (red) than non-modal (green) serial reversal strategies from error. Ciliates learn via Markov Szilárd-engine processes to improve fidelity between strategy planning and execution stages for all strategies for each corrective. All trend lines for panels (B) through (E) are fitted to second-order polynomial equations. Black trend lines represent composites of modal and non-modal serial strategy trends. Symbol T in panels (A) and (B) is temperature in °K.

