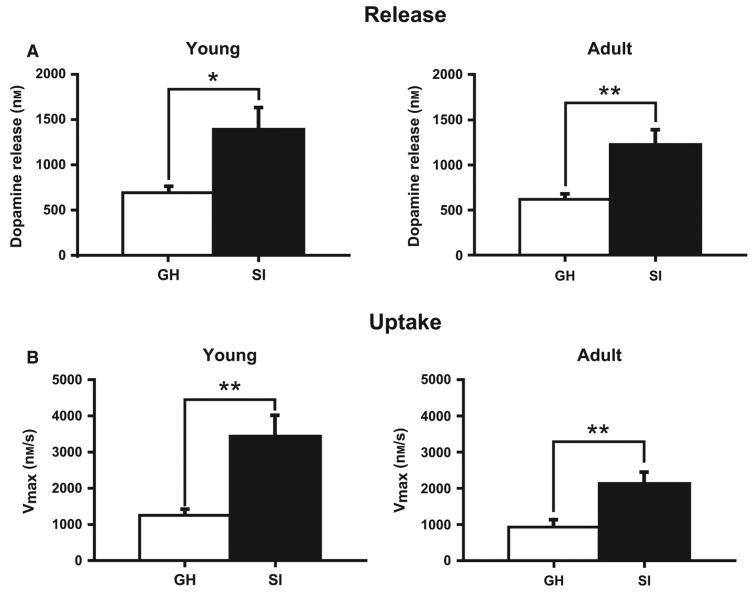
Fig. 4.
Effect of isolation rearing on stimulated dopamine release and uptake rate within the NAc. (A) Bar graph of mean (± SEM) stimulated dopamine release in socially isolated (SI) and group-housed (GH) rats at young (left; PD = 84 ± 7; GH n = 8; SI n = 8) and adult (right; PD = 181 ± 7; GH n = 7; SI n = 7) time points. (B) Bar graph of mean (± SEM) dopamine uptake rates (Vmax) in SI and GH rats at young (left; PD = 84 ± 7; GH n = 8; SI n = 8) and adult (right; PD = 181 ± 7; GH n = 7; SI n = 7) time points. *P < 0.05, **P < 0.01.

