Abstract
Histotripsy is a cavitation-based ultrasound therapy that mechanically fractionates soft solid tissues into fluid-like homogenates. This paper investigates the feasibility of imaging the tissue elasticity change during the histotripsy process as a tool to provide feedback for the treatments. The treatments were performed on agar tissue phantoms and ex vivo kidneys using 3-cycle ultrasound pulses delivered by a 750-kHz therapeutic array at peak negative/positive pressure of 17/108 MPa and a repetition rate of 50 Hz. Lesions with different degrees of damage were created with increasing numbers of therapy pulses from 0 to 2000 pulses per treatment location. The elasticity of the lesions was measured with ultrasound shear wave elastography, in which a quasi-planar shear wave was induced by acoustic radiation force generated by the therapeutic array, and tracked with ultrasound imaging at 3000 frames per second. Based on the shear wave velocity calculated from the sequentially captured frames, the Young’s modulus was reconstructed. Results showed that the lesions were more easily identified on the shear wave velocity images than on B-mode images. As the number of therapy pulses increased from 0 to 2000 pulses/location, the Young’s modulus decreased exponentially from 22.1 ± 2.7 to 2.1 ± 1.1 kPa in the tissue phantoms (R2 = 0.99, N = 9 each), and from 33.0 ± 7.1 to 4.0 ± 2.5 kPa in the ex vivo kidneys (R2 = 0.99, N = 8 each). Correspondingly, the tissues transformed from completely intact to completely fractionated as examined via histology. A good correlation existed between the lesions’ Young’s modulus and the degree of tissue fractionation as examined with the percentage of remaining structurally intact cell nuclei (R2 = 0.91, N = 8 each). These results indicate that lesions produced by histotripsy can be detected with high sensitivity using shear wave elastography. Because the decrease in the tissue elasticity corresponded well with the morphological and histological change, this study provides a basis for predicting the local treatment outcomes from tissue elasticity change.
I. Introduction
Histotripsy is a cavitation-based tissue ablation therapy that mechanically fractionates soft tissues using high-intensity, extremely short ultrasound pulses [1]–[4]. During the treatments, the tissues progressively transform from soft solids to fluid-like homogenates. This technique has been shown to successfully fractionate target tissues with high precision in many in vivo models [3], [5]–[8], demonstrating its potential to become a useful therapy tool for noninvasive tissue removal.
Image-based feedback information about the treatment efficacy during and after the treatment is important for a non-invasive therapy such as histotripsy. Our previous study has shown that the quantitative measurement of the ultrasound backscatter intensity can be used to predict the degree of tissue fractionation as the scattering tissue structures are progressively fractionated to small debris that no longer scatters ultrasound effectively [9], [10]. The backscatter measurement, however, is not sensitive enough to detect the tissue damage at an early stage of the treatment. More sensitive measurement can be achieved with magnetic resonance (MR) T2-weighted imaging [11]. The major drawback of MR is the high cost and the requirement for MR-compatible ultrasound therapy systems so that feedback can be provided during the treatments.
Ultrasound elastography (or elasticity imaging) [12]–[18] may be a cost-effective alternative that can characterize the histotripsy lesions with high sensitivity. The general approach for elastography includes application of stress, estimation of stress-induced strain, and reconstruction of tissue elasticity from the stress-strain relations. The stress can be applied with static or sinusoidal mechanical compression directly exerted on the tissues with mechanical compressors (e.g., [12]–[14], [19], [20]). However, the mechanical compression limits the applicable imaging range to superficial tissues because of the difficulty of propagating the force to deep-lying tissues. Furthermore, artifacts may arise from incomplete knowledge of the boundary conditions [21]. As such, an alternative approach has been developed to remotely apply the stress in the deep-lying tissues using acoustic radiation force [16], [22]–[26]. The acoustic radiation force is generated in the tissues along the propagation path of ultrasound by the momentum transfer from the acoustic wave to the medium via absorption and/or reflection of ultrasound. A short duration (~milliseconds) of focused ultrasound can induce an impulsive push in the focal region, which subsequently launches transient shear waves propagating laterally away from the focal region. Because the velocity and attenuation of the shear waves are directly related to the elasticity and viscosity of the tissues [27], the elasticity can be derived from the spatial-temporal recording of the shear waves by direct inversion of the Helmhotz equation [16], [17], [28], or estimation of the local propagation velocity [29]–[32]. Elastography can provide higher specificity and sensitivity for disease diagnosis [20], [33], [34] as a result of the high elasticity contrast between diseased and normal tissues [35], [36]. Elastography has been successful in the detection of liver cirrhosis [19], [37], renal disease [33], [38], [39], myocardial ischemia [40], [41], prostate cancer and/or breast lesions [20], [21], [42]–[46], as well as thermal lesions produced by radio-frequency or ultrasonic ablation therapy [47]–[52]. In contrast to thermal therapy, which produces stiffened tissues, histotripsy results in soft homogenized tissues in the treated volume. Such tissue transformation may be detected with high sensitivity using elastography because of the potentially high contrast in elasticity between normal and treated tissues.
In this paper, we hypothesize that tissue elasticity decreases as the tissues are progressively fractionated with increasing numbers of therapy pulses. We first investigated the feasibility of imaging the elasticity change using shear wave elastography, in which shear waves were induced by an impulsive push generated by the therapeutic array transducer and tracked with high-frame-rate ultrasound imaging. Next, the quantitative correlation between the tissue elasticity (i.e., Young’s modulus) and the degree of tissue fractionation was studied. This correlation, if established, could provide a basis for predicting the treatment outcomes with tissue elasticity change.
II. Materials and Methods
A. Sample Preparation
Experiments were performed on agar-graphite tissue mimicking phantoms and ex vivo kidneys. To prepare the agar-graphite tissue mimicking phantoms, agar powder (AG-SP, Lab Scientific, Livingston, NJ) was mixed in deionized water at 0.8% w/v concentration. The mixture was heated in a microwave oven until the agar completely melted in the solution. Next, the graphite powder (extra-fine graphite powder, Mr. Zip, Muskegon, MI) was mixed into the agar solution at 3% w/v concentration. To ensure homogeneous distribution of graphite in the phantom, the agar-graphite solution was stirred with a magnetic stirrer (Cimarec, Thermo Scientific, Asheville, NC) until it was fully solidified. The agar-graphite phantom appears to be macroscopically homogeneous, but contains 100- to 200-μm graphite aggregates under microscopic examination. These aggregates can be fractionated into very fine (<30 μm) debris after the histotripsy treatments. Morphologically, the treated volume transformed into paste-like homogenate that never re-solidifies to gel (a sign of mechanical rather than thermal damage).
Freshly excised porcine kidneys were obtained from a local abattoir. The kidneys were placed in normal saline at 4°C with the capsule removed. All samples were used within 48 h of harvest. Prior to experimentation, the kidneys were submerged in degassed (20 to 30% of normal saturation determined by pO2) saline at room temperature for ~1 h. The kidneys were then dissected across the long axis, resulting in two ~6-cm-thick sections with ~6 × ~5 cm cut surface. The kidney sections were embedded in 0.8% agar gel prepared with normal saline in a polycarbonate holder.
B. Experimental Setup
A 750-kHz therapeutic array transducer (Imasonic, Voray sur l’Ognon, France) was used to generate both the therapy pulses for histotripsy and the push pulses for shear wave imaging. The transducer has a geometric focal length of 12 cm, with an aperture size of 15 cm and a center hole of 5.9 cm diameter. The array consists of nine 5-mm-wide concentric rings, each dissected into two half-ring elements. The driving signal of each element can be individually adjusted by a custom-built array control system, allowing for electronic steering in the axial direction and f-number control. A 5-MHz 128-element linear-array imaging probe (L7-4, Philips Healthcare, Andover, MA) connected to a research ultrasound imaging system (V1, Verasonics, Redmond, WA) was used to collect the image data.
The experimental apparatus is shown in Fig. 1. The therapeutic transducer was mounted to a manual 3-axis positioning system. The imaging probe was mounted in the experimental tank opposite the therapeutic array. The beam axis of the therapeutic transducer was aligned to the imaging plane by the following approach. A bubble cloud was induced in the water with brief excitation of the therapeutic transducer. The therapeutic transducer was placed so that the bubble cloud appeared with highest backscatter amplitude and largest spatial extent on the ultrasound images. After the alignment, the phantom or tissue was mounted to a motorized 3-axis positioning system and submerged in the tank approximately at the geometric focus of the therapeutic transducer. For the tissue experiments, the kidney-gel blocks were positioned with the long axis of the kidney approximately parallel to the imaging plane. In this orientation, exposures were made through the renal cortex without obstruction from the renal pelvis.
Fig. 1.
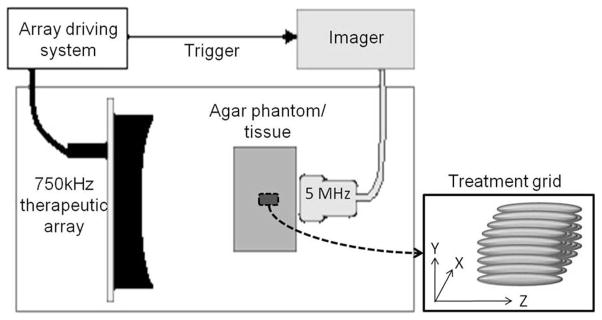
Experimental setup. The 5-MHz linear array imaging probe and the 750-kHz therapeutic array transducer were mounted on opposite sides of the agar phantoms/tissues in a tank of degassed water (25 to 35% of normal saturation determined by pO2). The imager was synchronized with the therapeutic array driving system. Lesions were produced by mechanically scanning the therapy focus in a 5 × 5 grid with 1-mm spacing.
C. Histotripsy Treatments
Histotripsy therapy pulses of 3 cycles in duration were delivered at 50 Hz pulse repetition frequency (PRF) by the therapeutic array transducer. All elements on the array were driven in-phase with equal amplitude, resulting in an f-number 0.8 focal configuration. The pressure field was calibrated with a custom-built fiber-optic probe hydrophone (FOPH) with an active element of 100 μm diameter [53]. The peak negative (P−) and peak positive (P+) pressures were measured to be −17 and 108 MPa, respectively. Because of attenuation of ultrasound in the agar-graphite phantoms (0.1 dB/cm/MHz [54]) and in the kidneys (1 dB/cm/MHz [55]), the P− pressures at the treatment location were likely ~16.5 MPa in the phantoms, and ~13 MPa in the kidneys. The P+ pressures were likely diminished more significantly as a result of nonlinear absorption. The −6-dB beamwidths were measured at a reduced P−/P+ pressure of −11/58 MPa. The lateral/axial −6-dB beamwidths were 2.6/17 mm on the P− pressure profile, and 1.2/7 mm on the P+ pressure profile. The beamwidths at higher pressures could not be successfully measured because the cavitation easily occurred and damaged the fiber tip during the pressure profile scan.
Lesions of approximately 7 × 7 × 14 mm were produced by mechanically scanning the therapy focus in a 5 × 5 grid with 1-mm spacing on the focal plane (Fig. 1). To produce different degrees of tissue fractionation, lesions were produced with 0, 100, 200, 300, 500, 1000, 1500, or 2000 therapy pulses per treatment location on the grid. A total of 72 treatments, 9 for each, were performed on the agar-graphite tissue phantoms. A total of 64 treatments, 8 for each, were performed on the ex vivo kidneys. After the treatments, the samples were moved 15 mm laterally on the imaging plane so that the shear wave elastography was performed with the shear waves excited from outside and propagating across the lesions.
D. Shear Wave Elastography
The shear wave elastography approach used in this study is similar to those described in the literature [23], [44]. To generate a quasi-planar shear wave, three ultrasound pushing beams were successively fired by the therapeutic array transducer focused at z = +5, 0, and −5 mm with respect to the geometric focus (i.e., z = 120 mm). The outer 5 rings were shut off, resulting in f-number focal configurations of 1.25, 1.2, and 1.15 for the three beams. A 2-μs delay was inserted between subsequent beams, allowing the update of the new focal delay pattern. The pulse parameters and the measured pressure fields of the three beams were summarized in Table I.
TABLE I.
Pulse Parameters for Acoustic Radiation Force Generation Under Free-Field Conditions.
| Push beam 1 | Push beam 2 | Push beam 3 | |
|---|---|---|---|
| Focal location (z, mm) | 125 | 120 | 115 |
| Lateral/axial (−6 db) beamwidth* on P− pressure profile (mm) | 3.5/38 | 3.2/36 | 3.0/35 |
| Lateral/axial (−6 db) beamwidth* on P+ pressure profile | 2.3/34 | 2.1/32 | 2.0/28 |
| P−/P+ Pressure** (MPa) | |||
| Phantom | −5/14 | −5/15 | −5/16 |
| Ex vivo tissue | −6/30 | −6/34 | −7/36 |
| Pulse duration (μs) | |||
| Phantom | 133 | 133 | 133 |
| Ex vivo tissue | 200 | 200 | 200 |
| ISPPA*** (kW/cm2) | |||
| Phantom | 1.3 | 1.5 | 1.6 |
| Ex vivo tissue | 2.3 | 2.5 | 2.8 |
Note that the beamwidth was narrower for shorter focal length (or smaller f-number).
The pressures at the treatment locations were expected to be lower than these measurements because of sound attenuation. Given a mean propagation distance of 3 cm and attenuation coefficients of 0.1 dB/cm/MHz in the agar-graphite phantoms [54], and 1 dB/cm/MHz in the kidneys [55], the P− pressures were estimated to be ~5 MPa both in the phantom and the ex vivo experiments.
ISPPA = spatial peak pulse average intensity.
To track the propagation of the shear waves at a high frame rate, ultrasound plane wave imaging [17] was performed. The imaging system generated a plane wave to illuminate the entire imaging field by simultaneously exciting all elements on the array. The system then started recording the backscatter signals after the plane wave was transmitted. Because the system can only receive signals from 64 channels a time, 2 successive transmit-receive sequences, each lasting for 77 μs, were conducted to collect the backscatter signals from the 38 × 38 mm field of view. A total of 72 frames were acquired from 1 ms after the pushing beams at a rate of 3000 frames per second. The total imaging duration lasted for 24 ms.
The channel data were collected and processed off-line. Conventional delay-and-sum beamforming with a f-number 1.5 dynamic receive focusing was applied to produce the beamformed RF images. The 1-D correlation-based speckle tracking algorithm [56] was then applied on the beamformed RF data to estimate the local tissue displacement. The RF data were transformed into analytical signals, and segmented into 1.5-mm regions with 75% overlap along the axial direction. The cross-correlation function of the segments from consecutive frames was calculated. The position of the maximum of the cross-correlation function was obtained by locating the phase zero-crossing around the maximum magnitude of the function. This position determined the tissue displacement between the consecutive frames.
This processing produced a series of spatial-temporal displacement images (e.g., Fig. 2) which allowed the estimation of the shear wave propagation velocity in each local area, (x, z). The propagation velocity was estimated using a time-of-flight algorithm [29], [44]. For each location (x, z), the temporal displacement profiles at two points across the location, u(x − Δx, z, t) and u(x + Δx, z, t), were extracted from the spatial-temporal displacement images. The propagation time, Δt, between the two points was obtained from the location of the maximum of the cross-correlation function of the two displacement profiles, u(x − Δx, z, t) and u(x + Δx, z, t). The propagation velocity was calculated as vs = 2 · Δx/Δt. To improve the quality of measurement, an average propagation velocity was calculated from multiple estimates with different spacing, Δx. In this study, the average velocity was calculated from 3 pairs of points with Δx = 0.6 to 0.9 mm. This set the resolution of the final elasticity map to be approximately 1.8 mm. The imaging process was repeated 3 times for the lesions created in the agar-graphite phantoms, and 9 times for those created in the kidneys. The average shear wave velocities were color-coded and overlaid on the B-mode images (e.g., Fig. 3).
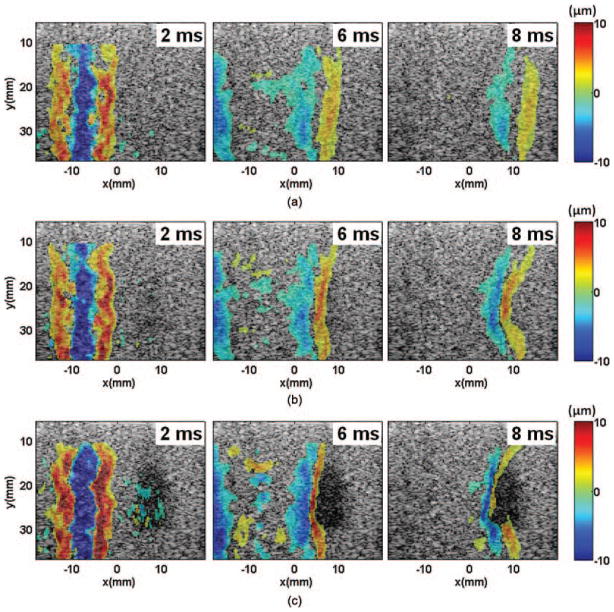
Fig. 2.
Spatial-temporal displacement images acquired at different times after the shear wave generation in the phantoms: (a) control, (b) 100 pulses, and (c) 1000 pulses. The positive and negative displacements indicate directions of motions toward and away from the imaging probe, respectively. The shear waves were generated in the left part of the field of view, centered at around x = −8 mm, and propagated away from the push region in opposite directions. The shear waves propagated at a lower speed in the lesion area, resulting in a bent wavefront as shown in panels (b) and (c). The curvature increased with increasing numbers of therapy pulses. The shear waves could not propagate far into the lesions created with more than 1000 pulses/location.
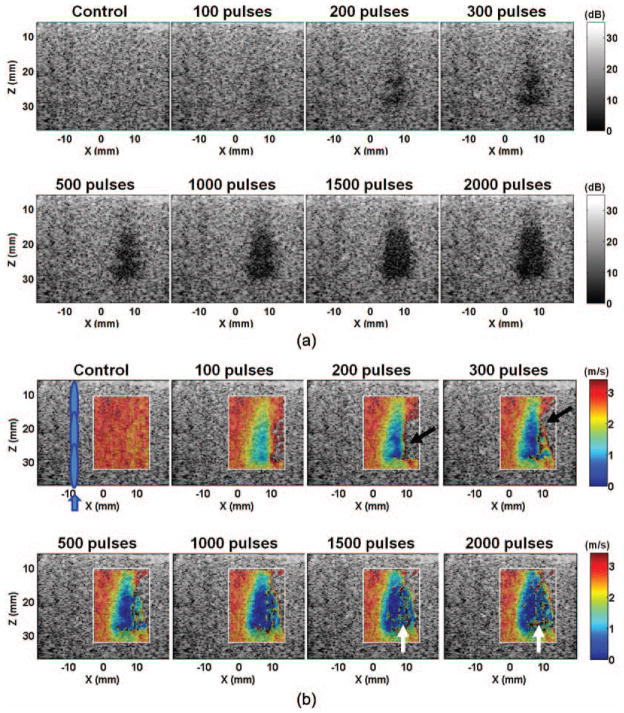
Fig. 3.
(a) B-mode and (b) shear wave velocity images of a representative lesion produced in the agar-graphite phantoms with increasing numbers of therapy pulses per treatment location. The treated volume became increasingly hypoechoic. Correspondingly, the shear wave velocity decreased in the treated volume. The lesions were more easily detected on the elastography than on the B-mode when small numbers of therapy pulses were applied (e.g., 100 pulses/location). The shear wave velocity in some areas opposite the push region (e.g., the areas indicated by black arrows) could not be measured. Noticeable noise was also present in the far end of the lesion (e.g., the areas indicated with the white arrows). These likely occurred because the shear waves were unable to propagate far into a significantly fractionated volume.
The Young’s modulus of the lesions was estimated from the measured shear wave velocities. It is assumed that the medium is isotropic, purely elastic (non-dispersive), incompressible, and locally homogeneous in each interrogated location. The Young’s modulus was then calculated using
| (1) |
where E is the Young’s modulus, μ is shear modulus, and ρ is the density of the medium (assumed to be 1000 kg/m3). A median Young’s modulus was calculated for each lesion in an 8 × 6 mm region approximately in the center of the lesions. As a comparison, the backscatter intensity in the same region was calculated and normalized to the backscatter intensity before the treatment using a method described in our previous publication [10].
To compare the lesion detectability with the elastography and the B-mode, the contrast-to-noise ratio (CNR) was calculated. The CNR was defined as
| (2) |
where S and σ are the spatial mean and standard deviation of the shear wave velocities on the elastography or the image magnitude on the B-mode.
To validate the elasticity measured with shear wave elastography, the elasticity of the untreated samples was also measured with a custom-built elastometer [57]. The phantoms or the kidney cortex were cut into 1-cm cubes and placed on an electronic balance. An aluminum rod with 8-mm diameter flat end was brought in contact with the samples. The rod was pressed into the samples step by step with a known step size. The scale reading was recorded to estimate the applied force for each step. A linear fit was applied to the stress-strain curves in the low-strain (<10%) regime. The slope of the linear fit was determined as the Young’s modulus of the samples.
E. Histological Examination
The treated tissues were fixed in 10% neutral buffered formalin and prepared for hematoxylin and eosin (H&E) staining. Histological sections of 4 μm thickness were made at 500-μm intervals through the lesion center with slices oriented in parallel with the ultrasound imaging plane. The sections were examined with a bright-field microscope at 400× magnification.
To evaluate the degree of tissue fractionation, the percentage of structurally intact cell nuclei remaining in the treated area was calculated. The cell nuclei were selected because they are a common indicator of cell or tissue damage. Moreover, they appeared more resistant to histotripsy damage than other cellular components, thus serving as a good indication of histotripsy-induced fractionation [10], [58]. The calculation followed the process described in our previous publication [10]. In brief, images of five 320 × 240 μm regions in the lesion area were captured. The locations of the five regions formed a cross pattern with 1.5-mm span in 4 directions centered approximately at the lesion center. The numbers of the structurally intact cell nuclei were counted for the five images. An average of the five counts was obtained and normalized to the average count from an untreated area (control), producing a percentage of remaining structurally intact cell nuclei. This percentage may represent the degree of tissue fractionation caused by histotripsy.
III. Results
A. Experiments on Agar-Graphite Phantoms
Fig. 2 shows the spatial-temporal displacement images induced by the shear waves in the phantoms. Displacement of several tens of micrometers was detected in the push region. Quasi-planar shear waves were launched from the push region and propagated outward in the lateral direction [Fig. 2(a)]. The shear waves propagated at a slower speed in the treated area, leading to a bent wavefront [e.g., Figs. 2(b) and 2(c)]. The propagation speed decreased with increasing numbers of therapy pulses. When more than 1000 pulses/location were applied, the shear waves could not propagate very far into the treated area within the 24-ms observation period.
The B-mode and the shear wave velocity images of a representative lesion treated with increasing numbers of therapy pulses are shown in Fig. 3. As the number of therapy pulses increased, the treated area became increasingly hypoechoic on the B-mode images. Correspondingly, the shear wave velocities decreased in the treated area, indicating a softer area produced by histotripsy. The treated area was more easily identified on the shear wave velocity images than on the B-mode images, particularly when small numbers of therapy pulses were applied (e.g., 100 pulses per treatment location). The shear wave velocities in the majority of the treated area were successfully measured except for some regions in the far end, opposite the region of shear wave generation. Unsuccessful or noisy measurements were obtained in these regions, likely because the shear waves were unable to propagate far into a sufficiently fractionated volume.
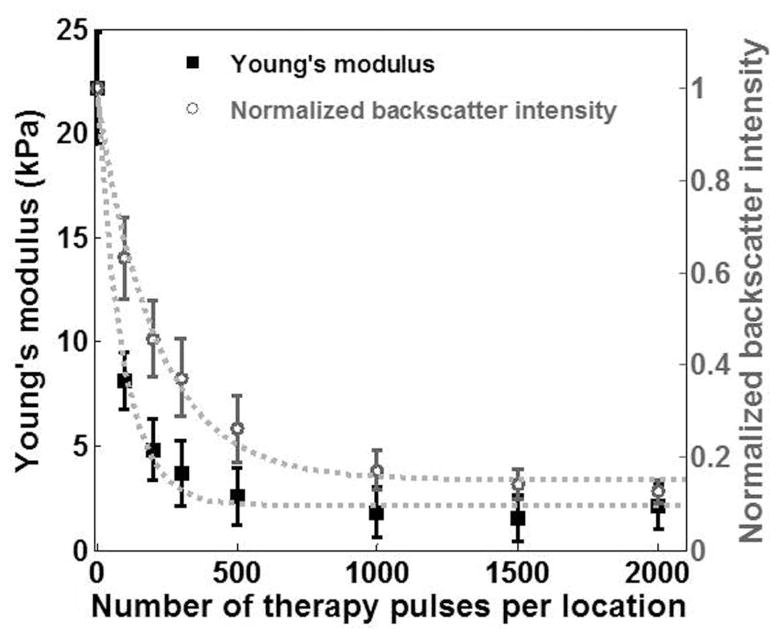
The Young’s modulus of the treated area decreased exponentially with increasing numbers of therapy pulses (R2 = 0.99, Fig. 4). This decrease leveled off when more than 500 pulses/location were applied. The Young’s modulus of the untreated agarose phantoms measured with shear wave elastography was comparable with that measured with the elastometer, i.e., 26.6 ± 2.6 kPa (N = 7). In comparison, the normalized backscatter intensity also decreased exponentially with increasing numbers of therapy pulses (R2 = 0.99, Fig. 4). However, it decreased at a much slower rate. For example, although the elasticity of the lesions produced with 100 pulses/location dropped by 63%, the backscatter intensity only decreased by 36%.
Fig. 4.
The Young’s modulus and the normalized backscatter plotted against the numbers of therapy pulses for lesions produced in the phantoms. Each data point represents the mean ± standard deviation from 9 independent treatments. The dashed line represents the exponential fit with the number of pulses centered at zero mean and scaled to unit standard deviation (i.e., Young’s modulus: y = 0.01 · e−8.1·((x − 700)/729) + 2.18, R2 = 0.99; normalized backscatter intensity: y = 0.03 · e−3.5·((x − 700)/729) + 0.15, R2 = 0.99).
The CNRs of the lesion images on the elastography and on the B-mode imaging are shown in Table II. The CNR was significantly higher on the elastography than on the B-mode imaging in all experiments (p < 0.001; t-test). This indicates that the elastography provides higher lesion detectability than the B-mode does. It was observed that the CNR on the elastography first increased and then decreased with increasing numbers of therapy pulses. The initial increase resulted from increased contrast between the lesion and the background. The following decrease occurred because noisy measurements were obtained in the lesion produced with a large number of therapy pulses.
TABLE II.
Contrast-To-Noise Ratio (CNR) of the Lesions on Shear Velocity Images and B-Mode Images.
| Treatment parameters (pulses/location) | CNR in agar phantoms
|
CNR in ex vivo kidneys
|
||
|---|---|---|---|---|
| Shear wave velocity image | B-mode image | Shear wave velocity image | B-mode image | |
| 0 (control) | 0.1 ± 0.1 | 0.1 ± 0.1 | 0.1 ± 0.1 | 0.1 ± 0.1 |
| 100 | 6.0 ± 1.1 | 0.5 ± 0.1 | 1.2 ± 0.6 | 0.2 ± 0.2 |
| 200 | 6.8 ± 1.2 | 0.7 ± 0.1 | 1.8 ± 0.8 | 0.3 ± 0.2 |
| 300 | 7.3 ± 1.4 | 0.9 ± 0.1 | 2.4 ± 0.8 | 0.4 ± 0.2 |
| 500 | 8.1 ± 1.0 | 1.1 ± 0.1 | 2.6 ± 0.9 | 0.6 ± 0.2 |
| 1000 | 8.9 ± 2.8 | 1.3 ± 0.1 | 3.2 ± 0.9 | 0.8 ± 0.2 |
| 1500 | 8.2 ± 3.3 | 1.3 ± 0.1 | 3.1 ± 1.2 | 0.9 ± 0.2 |
| 2000 | 5.3 ± 2.8 | 1.4 ± 0.1 | 3.0 ± 1.2 | 1.0 ± 0.3 |
The mean ± standard deviation is listed (N = 9 for phantom studies; N = 8 for ex vivo tissue studies).
B. Experiments on Ex Vivo Kidneys
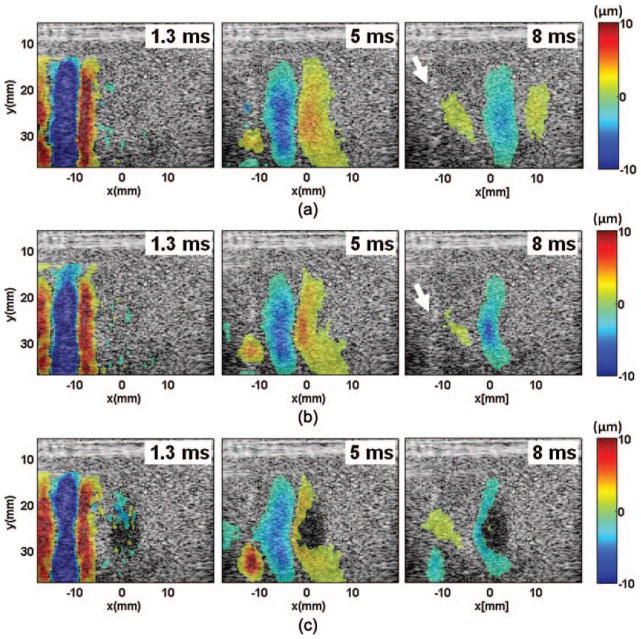
Fig. 5 shows the spatial-temporal displacement images induced by the shear waves in the kidney tissues. Similar to the phenomena observed in the phantom study (Fig. 2), quasi-planar shear waves were launched from the push region. The shear waves propagated at a lower speed in the treated area, and could not propagate very far into lesions created with large numbers of therapy pulses (>1000 pulses/location). The shear waves appeared to disperse and attenuate faster in the tissues (Fig. 5) compared with those in the phantoms (Fig. 2). It is worth noting that cavitation bubbles could have been generated by the pushing beams, as indicated by the bright spots in the push region (Fig. 5).
Fig. 5.
Spatial-temporal displacement images acquired at different times after the shear wave generation in the ex vivo kidneys: (a) control, (b) 100 pulses, and (c) 1000 pulses. The positive and negative displacements indicate directions of motions toward and away from the imaging probe, respectively. Compared with the shear waves generated in the phantoms, the shear waves generated in the kidneys appeared to be more dispersive and attenuated faster. The shear waves slowed down in the lesion area, resulting in a bent wavefront as shown in panels (b) and (c). The curvature increased with increasing numbers of therapy pulses. The shear waves could not propagate very far into the lesion created with more than 1000 pulses/location. Bright spots, likely cavitation bubbles, were observed in the push region after the pushing beams were delivered (examples indicated by the white arrows).
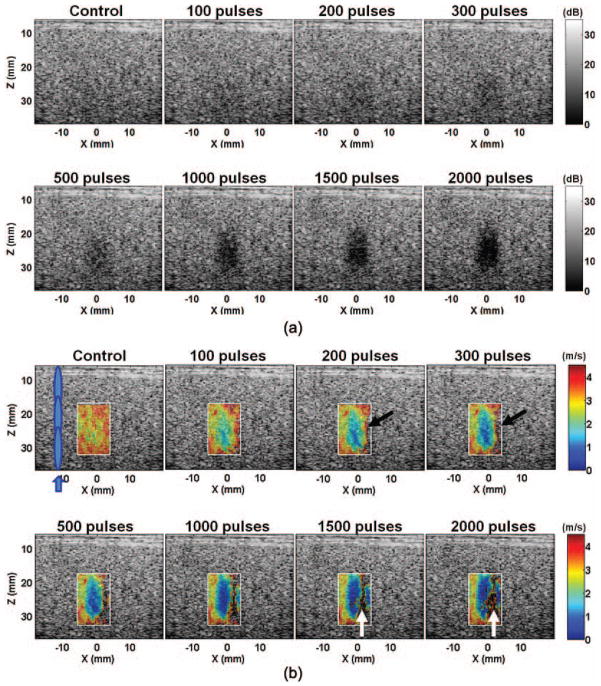
The B-mode and the shear wave velocity images of a representative lesion treated with increasing numbers of pulses are shown in Fig. 6. The treated volume was identified as an increasing hypoechoic area on the B-mode images, or a softer area with reduced shear wave velocity on the shear wave velocity images. The treated area was more easily identified on the shear wave velocity images than on the B-mode images, particularly at a small number of pulses (<500 pulses per treatment location). Unsuccessful or noisy measurements were obtained in the far end of the lesion opposite the region of shear wave generation because the shear waves could not propagate very far into the fractionated volume. Despite these limitations, the lesions depicted on the B-mode and shear wave velocity images corresponded well with their morphological appearance (Fig. 7).
Fig. 6.
(a) B-mode and (b) shear wave velocity images of a representative lesion produced in the ex vivo kidneys with increasing numbers of pulses per treatment location. Both the backscatter and the shear wave velocity decreased with increasing numbers of pulses. The lesions were more easily detected on the shear wave velocity images than on the B-mode when small numbers of therapy pulses were applied (e.g., 500 pulses/location). The shear wave velocity in some areas opposite to the push region (e.g., the areas indicated by black arrows) could not be measured. Noticeable noise was present in the far end of the lesion (e.g., the areas indicated with the white arrows). These likely occurred because the shear waves were unable to propagate far into a sufficiently fractionated volume.
Fig. 7.
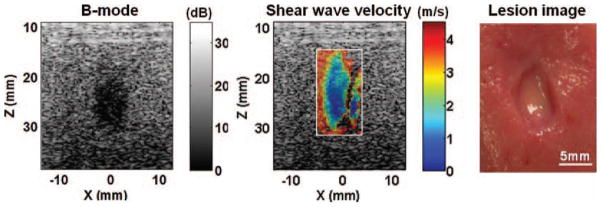
The B-mode image, shear wave velocity image, and gross morphology of a representative lesion produced in the kidneys. The size and shape of the lesion depicted on the B-mode and shear wave velocity images corresponded well with those observed from the morphological appearance.
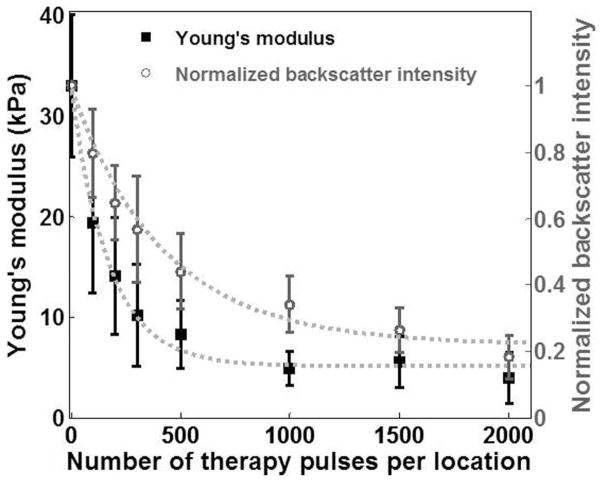
The Young’s modulus decreased exponentially with increasing numbers of therapy pulses, and leveled off after more than 1000 pulses/location were applied (R2 = 0.99, Fig. 8). The Young’s modulus of the untreated kidney tissues measured with the shear wave elastography was comparable with that measured with the elastometer, i.e., 30.2 ± 4.5 kPa (N = 8). The normalized backscatter intensity also decreased exponentially with increasing numbers of therapy pulses. For lesions produced with the same number of therapy pulses, the decrease in the elasticity was more significant than that in the normalized backscatter intensity. In addition, the CNRs on the lesion shear wave velocity images were significantly higher than those on the B-mode images in all experiments (p < 0.001, t-test; see Table II). These results indicate that the lesions may be detected with higher sensitivity using elastography.
Fig. 8.
The Young’s modulus and the normalized backscatter plotted against the numbers of therapy pulses for lesions produced in the ex vivo kidney tissues. Each data point represents the mean ± standard deviation from 8 independent treatments. The dashed line represents the exponential fit with the number of therapy pulses centered at zero mean and scaled to unit standard deviation (i.e., Young’s modulus: y = 0.47 · e−4.23·((x − 700)/729) + 5.20, R2 = 0.99; normalized backscatter intensity: y = 0.15 · e−1.7·((x − 700)/729) + 0.22, R2 = 0.99).
C. Histological Examinations
Representative histological sections of the lesions produced with increasing numbers of pulses are shown in Fig. 9. In the control, all tissue structures and cell nuclei appeared structurally intact. In the treated area, damages to the tissue structures (e.g., disintegrated tubules) and the cellular components (e.g., pyknotic or fragmented cell nuclei) were observed. Increasingly more damage was observed with increasing numbers of therapy pulses. With small numbers of therapy pulses, small portions of the treated volume were damaged but most parts remained structurally intact. As the numbers of pulses increased, larger portions of the tissues were damaged and more damaged cell nuclei were found. With large numbers of therapy pulses (>1000 pulses/location), the treated volume appeared to be completely homogenized, with no recognizable tissue structures.
Fig. 9.
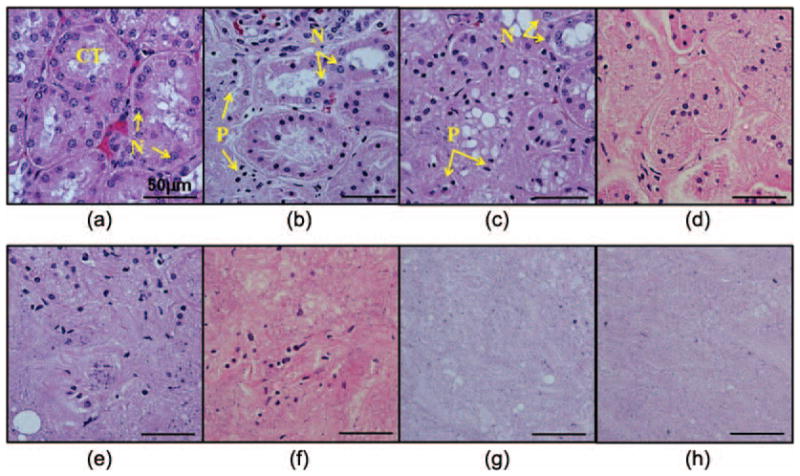
Hematoxylin and eosin (H&E)-stained histological sections of the lesions produced in the ex vivo kidneys with increasing numbers of pulses per treatment location: (a) control, (b) 100 pulses, (c) 200 pulses, (d) 300 pulses, (e) 500 pulses, (f) 1000 pulses, (g) 1500 pulses, and (h) 2000 pulses. In the control, the tissue structures [e.g., convoluted tubules (CT)] appeared structurally intact. Normal-appearing cell nuclei (N) were observed in all regions. In the treated area, damages to the tissue structures (e.g., disintegrated tubules) and cellular components (pyknotic or fragmented cell nuclei) were observed. The degrees of damage increased with increasing numbers of therapy pulses. When small numbers of therapy pulses were applied, small portions of the tissues were damaged [e.g., the left part in panel (b)] but most parts remained structurally intact. Some damaged (pyknotic or fragmented) cell nuclei (P) were observed. As the numbers of pulses increased, more damage occurred to both the tissue structures and the cell nuclei. With therapy pulses higher than 1000 pulses/location, the treated volume appeared to be completely homogenized with no recognizable tissue structures.
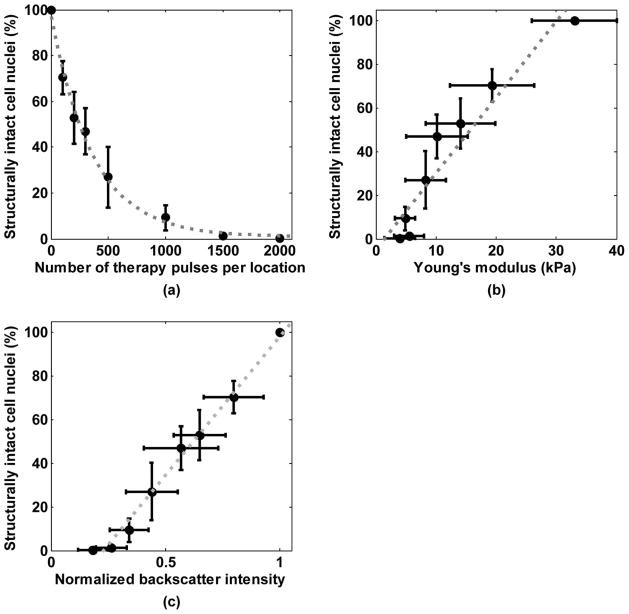
The degree of tissue fractionation was examined using the percentage of the remaining structurally intact cell nuclei and plotted against the number of therapy pulses in Fig. 10(a). The percentage of the remaining intact nuclei decreased exponentially with increasing numbers of therapy pulses (R2 = 0.99). This percentage was further correlated to the Young’s modulus of the treated tissues [Fig. 10(b)]. A good linear correlation was found between the percentage of the remaining intact nuclei and the lesion’s Young’s modulus (R2 = 0.91). A good linear correlation was also found between the percentage of the remaining intact cell nuclei and the normalized backscatter intensity [R2 = 0.99, Fig. 10(c)]. This trend is consistent with our previous study [10].
Fig. 10.
(a) Percentage of structurally intact cell nuclei remaining in the treated area decreased exponentially with increasing numbers of pulses. Each data point represents the mean ± standard deviation from 8 independent treatments. The dashed line represents the exponential fit with the number of therapy pulses centered at zero mean and scaled to unit standard deviation, i.e., y = 0.14 · e−1.98·((x − 700)/729) + 0.01, R2 = 0.99. (b) Correlation between the percentage of the remaining structurally intact cell nuclei and the Young’s modulus. The dashed line represents the linear fit, y = 0.03 · x − 0.05, R2 = 0.91. (c) Correlation between the percentage of the remaining structurally intact cell nuclei and the normalized backscatter intensity. The dashed line represents the linear fit, y = 1.27 · x − 0.29, R2 = 0.99.
IV. Discussion
Elastography appears to be a more sensitive measurement for detecting tissue fractionation in the early stage of the histotripsy treatment compared with another imaging feedback metric, backscatter reduction [9], [10]. This is supported by results from visual inspection (Fig. 3 and Fig. 6) and CNR measurements (Table II). The capability of detecting minor damage at the beginning of the treatment is extremely helpful for histotripsy because it allows for precise targeting, analysis, and optimization of the treatment parameters.
In addition to higher sensitivity, elastography can compensate for some discrepancy of the feedback with backscatter reduction in vivo. Our experience in the in vivo studies has shown that the backscatter reduction is apparent during and within several minutes after the treatments. The backscatter intensity may increase again several minutes later, possibly because the blood coagulated in the treated volume. In this situation, the lesions may still be detectable with elastography because the newly formed blood clot is likely much softer (Young’s modulus ~2 kPa [59]) than normal tissues.
The Young’s moduli measured with shear wave elastography corresponded well with those measured with the elastometer. These measurements are also comparable to several results reported in the literature. For instance, the Young’s modulus of the tissue phantoms measured in this study is comparable to that reported in [60] (20 to 30 kPa). The Young’s modulus of the ex vivo kidney cortex is comparable to results from [61]–[63] (20 to 40 kPa), although higher than results from [64], [65] (7 to 15 kPa). Measurement errors in the Young’s modulus reported here may occur because of violations of assumptions in (1), i.e., the medium being isotropic, non-dispersive, and locally homogeneous. The tissues are generally dispersive, which causes higher frequencies to travel faster. The present work estimated the elasticity based on the group velocity of the shear waves, which contain a wide band of frequencies (center frequency = 130 to 220 Hz, −15-dB frequency band = 30 to 500 Hz). Therefore, the estimated elasticity could be higher than that estimated at a single lower frequency (e.g., 90 Hz in [65]). This effect has also been discussed by other researchers [44]. In addition to dispersion, the anisotropic nature of the renal cortex could cause direction-dependent measurements [64]. Furthermore, heterogeneities introduced at the lesion boundaries could also cause measurement errors. Despite these influences, the decreasing trend of the elasticity should hold during histotripsy treatments, serving as a good indicator of the tissue softening process.
The mechanism of acoustic radiation force generation in the current work may be different from that in most elastography setups for diagnostic purposes (e.g., [16], [23], [44], [66]). The acoustic radiation force could be generated via absorption and/or reflection of ultrasound. In diagnostic setups, the radiation force is generated primarily through absorption. To enhance the absorption within the safety regulations, the radiation force is commonly generated by ultrasound with a higher frequency (5 to 10 MHz), limited pressure (<5 MPa), and long duration (300 to 600 μs). In the current work, the radiation force is generated by ultrasound with similar duration (450 to 600 μs) but a lower frequency (750 kHz) and a slightly higher pressure (5 to 6 MPa). The radiation force caused by the absorption could be weaker because the absorption decreases with decreasing frequencies. However, the combination of low frequency, high pressure, and long pulse duration increased the likelihood of cavitation (as evidenced in Fig. 5). The strong reflection from the cavitation bubbles could have significantly enhanced the radiation force. The effect of cavitation on the radiation force generation is under investigation. On the other hand, the cavitation bubbles indeed produced noticeable damage on the histological sections of the tissues (not shown here). Therefore, we envision this setup to be applied within the target volume where the push region is to be ablated eventually. Such an approach can be very helpful for optimization of the therapeutic parameters before the treatment. For post-treatment lesion evaluation, because the push region must be outside the target volume, the push pulse parameters must be adjusted to meet the safety regulations for diagnostic ultrasound. A higher-frequency transducer should be used to generate sufficient radiation force at a lower intensity. Other elastography-based approaches may also be applied. For example, the same push pulses used in this study can be delivered to the target volume. The tissue response in the target volume (e.g., how fast the tissue rebounds) can be measured to provide important information on the tissue fractionation process. These approaches are currently under investigation.
It is well known that shear waves only travel in solids, because fluids cannot support the shear stress. The fact that the shear waves were unable to propagate very far into a sufficiently fractionated volume indicates that the tissue was transformed from a soft solid into a fluid-like medium. This is consistent with our morphological examinations (e.g., [2], [4]).
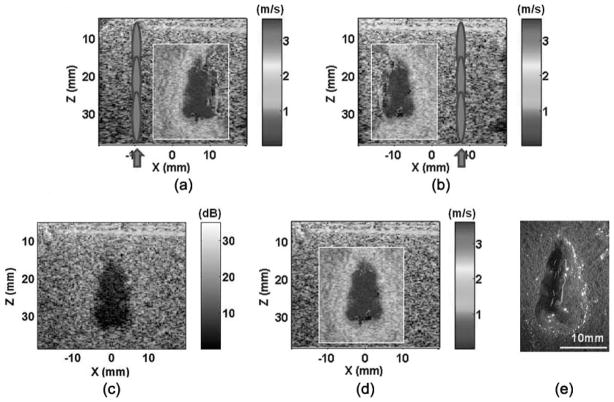
Because the tissue is fractionated into a fluid-like homogenate, shear wave propagation is increasingly restricted. Moreover, as the treatment volume approaches complete fractionation, the decreased backscatter can reduce image signals needed in the detection of the shear waves. Thus, as the treatment reaches these advanced stages, the accuracy of the elasticity measurement may decrease. Fortunately, complete fractionation of all cellular and tissue structures is far beyond what is necessary for most clinical applications. To improve the images as the treatment volume approaches complete fractionation, we propose use of an image compounding technique as shown in Fig. 11. Two shear wave velocity images were obtained separately with shear waves excited from the left or right side of the lesion. Using a simple image registration algorithm applied on the B-mode images, the two shear wave velocity images can be combined to provide a full map of the entire lesion.
Fig. 11.
Image compounding applied on a lesion produced in the tissue phantoms: (a) push in the left, (b) push in the right, (c) compounded B-mode image, (d) compounded shear wave velocity image, and (e) lesion. Panels (a) and (b) show the shear wave velocity images produced with shear waves generated on the left and right sides of the lesions, respectively. Using a simple image registration algorithm, the two images were compounded to form the full lesion images [panels (c) and (d)]. The compounded image better outlined the entire lesion, as confirmed with the lesion morphology [panel (e)].
V. Conclusions
Tissues treated with histotripsy become increasingly softer as they are fractionated by increasing numbers of therapy pulses. This tissue transformation process can be detected with high sensitivity using shear wave elastography. The created lesions depicted on the shear wave velocity images correspond well with their morphological appearance. Strong correlation exists between the lesion elasticity and the degree of tissue fractionation as examined by the percentage of remaining structurally intact cell nuclei. Because damage to the cell nuclei is directly related to cell death, tissue injury, and many other clinical outcomes, this correlation provides a basis for predicting histotripsy treatment outcomes from tissue elasticity change, allowing for a clinician to determine when sufficient treatment has occurred.
Acknowledgments
This work is supported by grants from the National Institutes of Health (grants R01 EB008998 and CA134579).
The authors thank Dr. C. Jia for her discussion and suggestions on the image processing algorithms, and Dr. F. Winterroth for his help on the elastometer setup.
Biographies

Tzu-Yin Wang is a postdoctoral research fellow in the Department of Biomedical Engineering at the University of Michigan, Ann Arbor, MI. She received her B.S. and M.S. degrees in electrical engineering from National Taiwan University, Tai-pei, Taiwan, in 2004 and 2006, and Ph.D. degree in biomedical engineering from the University of Michigan in 2011. Her research interests include biomedical imaging, image-guided therapy, and ultrasound therapies.
Timothy L. Hall was born in 1975 in Lansing, MI. He is currently an assistant research scientist in the Department of Biomedical Engineering at the University of Michigan. He received the B.S.E. degree in 1998 and M.S.E. degree in 2001, both in electrical engineering, and he received his Ph.D. degree in 2007 in biomedical engineering, all from the University of Michigan. He worked for Teradyne Inc., Boston, MA, from 1998 to 1999 as a circuit design engineer and at the University of Michigan from 2001 to 2004 as a visiting research investigator. His research interests are in high-power pulsed-RF-amplifier electronics, phased-array ultrasound transducers for therapeutics, and sonic cavitation for therapeutic applications.

Zhen Xu (S’05–M’06) is an assistant professor in the Department of Biomedical Engineering at the University of Michigan, Ann Arbor, MI. She received the B.S.E. (highest honors) degree in biomedical engineering from Southeast University, Nanjing, China, in 2001, and her M.S. and Ph.D. degrees from the University of Michigan in 2003 and 2005, respectively, both in biomedical engineering. Her research focuses on ultrasound therapy, particularly the applications of histotripsy for noninvasive surgeries. She received the IEEE Ultrasonics, Ferroelectrics, and Frequency Control Society 2006 Outstanding Paper Award. She was also selected as the best student paper competition finalist at the 2003 IEEE International Ultrasonics Symposium and 2005 International Symposium on Therapeutic Ultrasound.

Jeffery Brian Fowlkes (M’94–A’94) is a professor in the Departments of Radiology and Biomedical Engineering at the University of Michigan, Ann Arbor, MI. He is currently directing and conducting research in medical ultrasound, including the use of gas bubbles for diagnostic and therapeutic applications. His work includes studies of ultrasound contrast agents for monitoring tissue perfusion, acoustic droplet vaporization for bubble production in cancer therapy and phase aberration correction, effects of gas bubbles in high-intensity ultrasound, and volume flow estimation for ultrasonic imaging. Dr. Fowlkes received his B.S. degree in physics from the University of Central Arkansas in 1983 and his M.S. and Ph.D. degrees from the University of Mississippi in 1986 and 1988, respectively, both in physics. Dr. Fowlkes is a fellow of the American Institute of Ultrasound in Medicine and has served as secretary and as a member of its Board of Governors. He also received the AIUM Presidential Recognition Award for outstanding contributions and service to the expanding future of ultrasound in medicine. As a member of the Acoustical Society of America, Dr. Fowlkes has served on the Physical Acoustics Technical Committee and the Medical Acoustics and Bioresponse to Vibration Technical Committee. As a member of the IEEE, he has worked with the IEEE I&M Society Technical Committee on Imaging Systems. Dr. Fowlkes is a fellow of the American Institute of Medical and Biomedical Engineering.

Charles A. Cain (S’65–M’71–SM’80–F’89) was born in Tampa, FL, on March 3, 1943. He received the B.E.E. (highest honors) degree in 1965 from the University of Florida, Gainesville, FL; the M.S.E.E. degree in 1966 from the Massachusetts Institute of Technology, Cambridge, MA; and the Ph.D. degree in electrical engineering in 1972 from the University of Michigan, Ann Arbor, MI. From 1965 through 1968, he was a member of the Technical Staff at Bell Laboratories, Naperville, IL, where he worked in the electronic switching systems development area.
From 1972 through 1989, he was in the Department of Electrical and Computer Engineering at the University of Illinois at Urbana-Champaign, where he was a professor of electrical engineering and bioengineering. Since 1989, he has been in the College of Engineering at the University of Michigan, Ann Arbor, as a professor of biomedical engineering and electrical engineering. He was the chair of the Biomedical Engineering Program from 1989 to 1996; the founding chair of the Biomedical Engineering Department from 1996 to 1999; and the Richard A. Auhll Professor of Engineering in 2002.
He has been involved in research on the medical applications of ultrasound, particularly high-intensity ultrasound for noninvasive surgery. He was formerly an associate editor of the IEEE Transactions on Biomedical Engineering and the IEEE Transactions on Ultrasonics, Ferroelectrics, and Frequency Control and an editorial board member of the International Journal of Hyperthermia and Radiation Research. He is a fellow of the IEEE and the AIMBE.
Contributor Information
Tzu-Yin Wang, Email: tzuyin@umich.edu, Department of Biomedical Engineering, University of Michigan, Ann Arbor, MI.
Timothy L. Hall, Department of Biomedical Engineering, University of Michigan, Ann Arbor, MI
Zhen Xu, Department of Biomedical Engineering, University of Michigan, Ann Arbor, MI.
J. Brian Fowlkes, Department of Biomedical Engineering, University of Michigan, Ann Arbor, MI. Department of Radiology, University of Michigan, Ann Arbor, MI.
Charles A. Cain, Department of Biomedical Engineering, University of Michigan, Ann Arbor, MI. Department of Electrical Engineering and Computer Science, University of Michigan, Ann Arbor, MI.
References
- 1.Xu Z, Ludomirsky A, Eun LY, Hall TL, Tran BC, Fowlkes JB, Cain CA. Controlled ultrasound tissue erosion. IEEE Trans Ultrason Ferroelectr Freq Control. 2004 Jun;51:726–736. doi: 10.1109/tuffc.2004.1308731. [DOI] [PMC free article] [PubMed] [Google Scholar]
- 2.Parsons JE, Cain CA, Abrams GD, Fowlkes JB. Pulsed cavitational ultrasound therapy for controlled tissue homogenization. Ultrasound Med Biol. 2006 Jan;32:115–129. doi: 10.1016/j.ultrasmedbio.2005.09.005. [DOI] [PubMed] [Google Scholar]
- 3.Roberts WW, Hall TL, Ives K, Wolf JS, Jr, Fowlkes JB, Cain CA. Pulsed cavitational ultrasound: A noninvasive technology for controlled tissue ablation (histotripsy) in the rabbit kidney. J Urol. 2006 Feb;175:734–738. doi: 10.1016/S0022-5347(05)00141-2. [DOI] [PubMed] [Google Scholar]
- 4.Kieran K, Hall TL, Parsons JE, Wolf JS, Jr, Fowlkes JB, Cain CA, Roberts WW. Refining histotripsy: Defining the parameter space for the creation of nonthermal lesions with high intensity, pulsed focused ultrasound of the in vitro kidney. J Urol. 2007 Aug;178:672–676. doi: 10.1016/j.juro.2007.03.093. [DOI] [PubMed] [Google Scholar]
- 5.Lake AM, Hall TL, Kieran K, Fowlkes JB, Cain CA, Roberts WW. Histotripsy: Minimally invasive technology for prostatic tissue ablation in an in vivo canine model. Urology. 2008 Mar 14;72:682–686. doi: 10.1016/j.urology.2008.01.037. [DOI] [PMC free article] [PubMed] [Google Scholar]
- 6.Kim Y, Gelehrter SK, Fifer CG, Lu JC, Owens GE, Berman DR, Williams J, Wilkinson JE, Ives KA, Xu Z. Non-invasive pulsed cavitational ultrasound for fetal tissue ablation: Feasibility study in a fetal sheep model. Ultrasound Obstet Gynecol. 2011;37(4):450–457. doi: 10.1002/uog.8880. [DOI] [PubMed] [Google Scholar]
- 7.Owens GE, Miller RM, Ensing G, Ives K, Gordon D, Ludomirsky A, Xu Z. Therapeutic ultrasound to noninvasively create intracardiac communications in an intact animal model. Catheter Cardiovasc Interv. 2011 Mar 1;77:580–588. doi: 10.1002/ccd.22787. [DOI] [PMC free article] [PubMed] [Google Scholar]
- 8.Xu Z, Owens G, Gordon D, Cain C, Ludomirsky A. Noninvasive creation of an atrial septal defect by histotripsy in a canine model. Circulation. 2010 Feb 16;121:742–749. doi: 10.1161/CIRCULATIONAHA.109.889071. [DOI] [PMC free article] [PubMed] [Google Scholar]
- 9.Hall TL, Fowlkes JB, Cain CA. A real-time measure of cavitation induced tissue disruption by ultrasound imaging backscatter reduction. IEEE Trans Ultrason Ferroelectr Freq Control. 2007 Mar;54:569–575. doi: 10.1109/tuffc.2007.279. [DOI] [PubMed] [Google Scholar]
- 10.Wang TY, Xu Z, Winterroth F, Hall TL, Fowlkes JB, Rothman ED, Roberts WW, Cain CA. Quantitative ultrasound backscatter for pulsed cavitational ultrasound therapy—Histotripsy. IEEE Trans Ultrason Ferroelectr Freq Control. 2009;56(5):995–1005. doi: 10.1109/tuffc.2009.1131. [DOI] [PMC free article] [PubMed] [Google Scholar]
- 11.Hall TL. Ph D dissertation. Biomedical Engineering Dept., University of Michigan; Ann Arbor: 2007. Histotripsy: Non-invasive ultrasound surgery. [Google Scholar]
- 12.Parker KJ, Huang SR, Musulin RA, Lerner RM. Tissue response to mechanical vibrations for “sonoelasticity imaging”. Ultrasound Med Biol. 1990;16(3):241–246. doi: 10.1016/0301-5629(90)90003-u. [DOI] [PubMed] [Google Scholar]
- 13.Ophir J, Cespedes I, Ponnekanti H, Yazdi Y, Li X. Elastography: A quantitative method for imaging the elasticity of biological tissues. Ultrason Imaging. 1991 Apr;13:111–134. doi: 10.1177/016173469101300201. [DOI] [PubMed] [Google Scholar]
- 14.O’Donnell M, Skovoroda AR, Shapo BM, Emelianov SY. Internal displacement and strain imaging using ultrasonic speckle tracking. IEEE Trans Ultrason Ferroelectr Freq Control. 1994;41(3):314–325. [Google Scholar]
- 15.Muthupillai R, Lomas DJ, Rossman PJ, Greenleaf JF, Manduca A, Ehman RL. Magnetic resonance elastography by direct visualization of propagating acoustic strain waves. Science. 1995 Sep 29;269:1854–1857. doi: 10.1126/science.7569924. [DOI] [PubMed] [Google Scholar]
- 16.Nightingale K, Soo MS, Nightingale R, Trahey G. Acoustic radiation force impulse imaging: In vivo demonstration of clinical feasibility. Ultrasound Med Biol. 2002 Feb;28:227–235. doi: 10.1016/s0301-5629(01)00499-9. [DOI] [PubMed] [Google Scholar]
- 17.Sandrin L, Tanter M, Catheline S, Fink M. Shear modulus imaging with 2-D transient elastography. IEEE Trans Ultrason Ferroelectr Freq Control. 2002 Apr;49:426–435. doi: 10.1109/58.996560. [DOI] [PubMed] [Google Scholar]
- 18.Wu Z, Taylor LS, Rubens DJ, Parker KJ. Sonoelastographic imaging of interference patterns for estimation of the shear velocity of homogeneous biomaterials. Phys Med Biol. 2004 Mar 21;49:911–922. doi: 10.1088/0031-9155/49/6/003. [DOI] [PubMed] [Google Scholar]
- 19.Sandrin L, Fourquet B, Hasquenoph JM, Yon S, Fournier C, Mal F, Christidis C, Ziol M, Poulet B, Kazemi F, Beaugrand M, Palau R. Transient elastography: A new noninvasive method for assessment of hepatic fibrosis. Ultrasound Med Biol. 2003 Dec;29:1705–1713. doi: 10.1016/j.ultrasmedbio.2003.07.001. [DOI] [PubMed] [Google Scholar]
- 20.Krouskop TA, Wheeler TM, Kallel F, Garra BS, Hall T. Elastic moduli of breast and prostate tissues under compression. Ultrason Imaging. 1998 Oct;20:260–274. doi: 10.1177/016173469802000403. [DOI] [PubMed] [Google Scholar]
- 21.Ophir J, Alam SK, Garra B, Kallel F, Konofagou E, Krouskop T, Varghese T. Elastography: Ultrasonic estimation and imaging of the elastic properties of tissues. Proc Inst Mech Eng H. 1999;213(3):203–233. doi: 10.1243/0954411991534933. [DOI] [PubMed] [Google Scholar]
- 22.Sarvazyan AP, Rudenko OV, Swanson SD, Fowlkes JB, Emelianov SY. Shear wave elasticity imaging: A new ultrasonic technology of medical diagnostics. Ultrasound Med Biol. 1998 Nov;24:1419–1435. doi: 10.1016/s0301-5629(98)00110-0. [DOI] [PubMed] [Google Scholar]
- 23.Bercoff J, Tanter M, Fink M. Supersonic shear imaging: A new technique for soft tissue elasticity mapping. IEEE Trans Ultrason Ferroelectr Freq Control. 2004 Apr;51:396–409. doi: 10.1109/tuffc.2004.1295425. [DOI] [PubMed] [Google Scholar]
- 24.Fatemi M, Greenleaf JF. Probing the dynamics of tissue at low frequencies with the radiation force of ultrasound. Phys Med Biol. 2000 Jun;45:1449–1464. doi: 10.1088/0031-9155/45/6/304. [DOI] [PubMed] [Google Scholar]
- 25.Walker WF, Fernandez FJ, Negron LA. A method of imaging viscoelastic parameters with acoustic radiation force. Phys Med Biol. 2000 Jun;45:1437–1447. doi: 10.1088/0031-9155/45/6/303. [DOI] [PubMed] [Google Scholar]
- 26.Nightingale KR, Palmeri ML, Nightingale RW, Trahey GE. On the feasibility of remote palpation using acoustic radiation force. J Acoust Soc Am. 2001 Jul;110:625–634. doi: 10.1121/1.1378344. [DOI] [PubMed] [Google Scholar]
- 27.Deffieux T, Montaldo G, Tanter M, Fink M. Shear wave spectroscopy for in vivo quantification of human soft tissues viscoelasticity. IEEE Trans Med Imag. 2009 Mar;28(3):313–322. doi: 10.1109/TMI.2008.925077. [DOI] [PubMed] [Google Scholar]
- 28.Gennisson JL, Cloutier G. Sol-gel transition in agar-gelatin mixtures studied with transient elastography. IEEE Trans Ultrason Ferroelectr Freq Control. 2006 Apr;53:716–723. doi: 10.1109/tuffc.2006.1621498. [DOI] [PubMed] [Google Scholar]
- 29.McLaughlin J, Renzi D. Shear wave speed recovery in transient elastography and supersonic imaging using propagating fronts. Inverse Probl. 2006;22(2):681–706. [Google Scholar]
- 30.Palmeri ML, Wang MH, Dahl JJ, Frinkley KD, Nightingale KR. Quantifying hepatic shear modulus in vivo using acoustic radiation force. Ultrasound Med Biol. 2008 Apr;34:546–558. doi: 10.1016/j.ultrasmedbio.2007.10.009. [DOI] [PMC free article] [PubMed] [Google Scholar]
- 31.Chen S, Urban MW, Pislaru C, Kinnick R, Zheng Y, Yao A, Greenleaf JF. Shearwave dispersion ultrasound vibrometry (SDUV) for measuring tissue elasticity and viscosity. IEEE Trans Ultrason Ferroelectr Freq Control. 2009 Jan;56:55–62. doi: 10.1109/TUFFC.2009.1005. [DOI] [PMC free article] [PubMed] [Google Scholar]
- 32.Muller M, Gennisson JL, Deffieux T, Tanter M, Fink M. Quantitative viscoelasticity mapping of human liver using supersonic shear imaging: Preliminary in vivo feasibility study. Ultrasound Med Biol. 2009 Feb;35:219–229. doi: 10.1016/j.ultrasmedbio.2008.08.018. [DOI] [PubMed] [Google Scholar]
- 33.Emelianov SY, Lubinski MA, Weitzel WF, Wiggins RC, Skovoroda AR, O’Donnell M. Elasticity imaging for early detection of renal pathology. Ultrasound Med Biol. 1995;21(7):871–883. doi: 10.1016/0301-5629(94)00146-5. [DOI] [PubMed] [Google Scholar]
- 34.Yeh WC, Li PC, Jeng YM, Hsu HC, Kuo PL, Li ML, Yang PM, Lee PH. Elastic modulus measurements of human liver and correlation with pathology. Ultrasound Med Biol. 2002 Apr;28:467–474. doi: 10.1016/s0301-5629(02)00489-1. [DOI] [PubMed] [Google Scholar]
- 35.Frizzell LA, Carstensen EL. Shear properties of mammalian tissues at low megahertz frequencies. J Acoust Soc Am. 1976 Dec;60:1409–1411. doi: 10.1121/1.381236. [DOI] [PubMed] [Google Scholar]
- 36.Goss SA, Johnston RL, Dunn F. Comprehensive compilation of empirical ultrasonic properties of mammalian tissues. J Acoust Soc Am. 1978 Aug;64:423–457. doi: 10.1121/1.382016. [DOI] [PubMed] [Google Scholar]
- 37.Castera L, Vergniol J, Foucher J, Le Bail B, Chanteloup E, Haaser M, Darriet M, Couzigou P, De Ledinghen V. Prospective comparison of transient elastography, Fibrotest, APRI, and liver biopsy for the assessment of fibrosis in chronic hepatitis C. Gastroenterology. 2005 Feb;128:343–350. doi: 10.1053/j.gastro.2004.11.018. [DOI] [PubMed] [Google Scholar]
- 38.Shah NS, Kruse SA, Lager DJ, Farell-Baril G, Lieske JC, King BF, Ehman RL. Evaluation of renal parenchymal disease in a rat model with magnetic resonance elastography. Magn Reson Med. 2004 Jul;52:56–64. doi: 10.1002/mrm.20101. [DOI] [PubMed] [Google Scholar]
- 39.Weitzel WF, Kim K, Rubin JM, Xie H, O’Donnell M. Renal advances in ultrasound elasticity imaging: Measuring the compliance of arteries and kidneys in end-stage renal disease. Blood Purif. 2005;23(1):10–17. doi: 10.1159/000082005. [DOI] [PubMed] [Google Scholar]
- 40.Lee WN, Provost J, Fujikura K, Wang J, Konofagou EE. In vivo study of myocardial elastography under graded ischemia conditions. Phys Med Biol. 2011 Feb 21;56:1155–1172. doi: 10.1088/0031-9155/56/4/017. [DOI] [PMC free article] [PubMed] [Google Scholar]
- 41.Jia C, Olafsson R, Kim K, Kolias TJ, Rubin JM, Weitzel WF, Witte RS, Huang SW, Richards MS, Deng CX, O’Donnell M. Two-dimensional strain imaging of controlled rabbit hearts. Ultrasound Med Biol. 2009 Sep;35:1488–1501. doi: 10.1016/j.ultrasmedbio.2009.04.007. [DOI] [PMC free article] [PubMed] [Google Scholar]
- 42.Bercoff J, Chaffai S, Tanter M, Sandrin L, Catheline S, Fink M, Gennisson JL, Meunier M. In vivo breast tumor detection using transient elastography. Ultrasound Med Biol. 2003 Oct;29:1387–1396. doi: 10.1016/s0301-5629(03)00978-5. [DOI] [PubMed] [Google Scholar]
- 43.Insana MF, Pellot-Barakat C, Sridhar M, Lindfors KK. Viscoelastic imaging of breast tumor microenvironment with ultrasound. J Mammary Gland Biol Neoplasia. 2004 Oct;9:393–404. doi: 10.1007/s10911-004-1409-5. [DOI] [PMC free article] [PubMed] [Google Scholar]
- 44.Tanter M, Bercoff J, Athanasiou A, Deffieux T, Gennisson JL, Montaldo G, Muller M, Tardivon A, Fink M. Quantitative assessment of breast lesion viscoelasticity: Initial clinical results using supersonic shear imaging. Ultrasound Med Biol. 2008 Sep;34:1373–1386. doi: 10.1016/j.ultrasmedbio.2008.02.002. [DOI] [PubMed] [Google Scholar]
- 45.Hall TJ, Zhu Y, Spalding CS. In vivo real-time freehand palpation imaging. Ultrasound Med Biol. 2003 Mar;29:427–435. doi: 10.1016/s0301-5629(02)00733-0. [DOI] [PubMed] [Google Scholar]
- 46.Zhang M, Nigwekar P, Castaneda B, Hoyt K, Joseph JV, di Sant’Agnese A, Messing EM, Strang JG, Rubens DJ, Parker KJ. Quantitative characterization of viscoelastic properties of human prostate correlated with histology. Ultrasound Med Biol. 2008 Jul;34:1033–1042. doi: 10.1016/j.ultrasmedbio.2007.11.024. [DOI] [PubMed] [Google Scholar]
- 47.Lizzi FL, Muratore R, Deng CX, Ketterling JA, Alam SK, Mikaelian S, Kalisz A. Radiation-force technique to monitor lesions during ultrasonic therapy. Ultrasound Med Biol. 2003 Nov;29:1593–1605. doi: 10.1016/s0301-5629(03)01052-4. [DOI] [PubMed] [Google Scholar]
- 48.Bharat S, Techavipoo U, Kiss MZ, Liu W, Varghese T. Monitoring stiffness changes in lesions after radio-frequency ablation at different temperatures and durations of ablation. Ultrasound Med Biol. 2005 Mar;31:415–422. doi: 10.1016/j.ultrasmedbio.2004.12.020. [DOI] [PubMed] [Google Scholar]
- 49.Varghese T, Zagzebski JA, Lee FT., Jr Elastographic imaging of thermal lesions in the liver in vivo following radio-frequency ablation: Preliminary results. Ultrasound Med Biol. 2002 Nov-Dec;28:1467–1473. doi: 10.1016/s0301-5629(02)00656-7. [DOI] [PubMed] [Google Scholar]
- 50.Righetti R, Kallel F, Stafford RJ, Price RE, Krouskop TA, Hazle JD, Ophir J. Elastographic characterization of HIFU-induced lesions in canine livers. Ultrasound Med Biol. 1999 Sep;25:1099–1113. doi: 10.1016/s0301-5629(99)00044-7. [DOI] [PubMed] [Google Scholar]
- 51.Wu T, Felmlee JP, Greenleaf JF, Riederer SJ, Ehman RL. Assessment of thermal tissue ablation with MR elastography. Magn Reson Med. 2001 Jan;45:80–87. doi: 10.1002/1522-2594(200101)45:1<80::aid-mrm1012>3.0.co;2-y. [DOI] [PubMed] [Google Scholar]
- 52.Fahey BJ, Nelson RC, Hsu SJ, Bradway DP, Dumont DM, Trahey GE. In vivo guidance and assessment of liver radio-frequency ablation with acoustic radiation force elastography. Ultrasound Med Biol. 2008 Oct;34:1590–1603. doi: 10.1016/j.ultrasmedbio.2008.03.006. [DOI] [PMC free article] [PubMed] [Google Scholar]
- 53.Parsons JE, Cain CA, Fowlkes JB. Cost-effective assembly of a basic fiber-optic hydrophone for measurement of high-amplitude therapeutic ultrasound fields. J Acoust Soc Am. 2006 Mar;119:1432–1440. doi: 10.1121/1.2166708. [DOI] [PubMed] [Google Scholar]
- 54.Burlew MM, Madsen EL, Zagzebski JA, Banjavic RA, Sum SW. A new ultrasound tissue-equivalent material. Radiology. 1980 Feb;134:517–520. doi: 10.1148/radiology.134.2.7352242. [DOI] [PubMed] [Google Scholar]
- 55.Duck FA. Physical Properties of Tissue: A Comprehensive Reference Book. London, UK: Academic; 1990. [Google Scholar]
- 56.Lubinski MA, Emelianov SY, O’Donnell M. Speckle tracking methods for ultrasonic elasticity imaging using short-time correlation. IEEE Trans Ultrason Ferroelectr Freq Control. 1999;46(1):82–96. doi: 10.1109/58.741427. [DOI] [PubMed] [Google Scholar]
- 57.Erkamp RQ, Wiggins P, Skovoroda AR, Emelianov SY, O’Donnell M. Measuring the elastic modulus of small tissue samples. Ultrason Imaging. 1998 Jan;20:17–28. doi: 10.1177/016173469802000102. [DOI] [PubMed] [Google Scholar]
- 58.Winterroth F, Xu Z, Wang TY, Wilkinson JE, Fowlkes JB, Roberts WW, Cain CA. Examining and analyzing subcellular morphology of renal tissue treated by histotripsy. Ultrasound Med Biol. 2011 Jan;37:78–86. doi: 10.1016/j.ultrasmedbio.2010.10.002. [DOI] [PMC free article] [PubMed] [Google Scholar]
- 59.Roy SC, Paulose M, Grimes CA. The effect of TiO2 nano-tubes in the enhancement of blood clotting for the control of hemorrhage. Biomaterials. 2007 Nov;28:4667–4672. doi: 10.1016/j.biomaterials.2007.07.045. [DOI] [PubMed] [Google Scholar]
- 60.Hall TJ, Bilgen M, Insana MF, Krouskop TA. Phantom materials for elastography. IEEE Trans Ultrason Ferroelectr Freq Control. 1997 Nov;44:1355–1365. [Google Scholar]
- 61.Cooper M, Zhen X, Rothman ED, Levin AM, Advincula AP, Fowlkes JB, Cain CA. Controlled ultrasound tissue erosion: The effects of tissue type, exposure parameters and the role of dynamic microbubble activity. IEEE Ultrasonics Symp. 2004;3:1808–1811. [Google Scholar]
- 62.Hostettler A, George D, Remond Y, Nicolau SA, Soler L, Marescaux J. Bulk modulus and volume variation measurement of the liver and the kidneys in vivo using abdominal kinetics during free breathing. Comput Methods Programs Biomed. 2010 Nov;100:149–157. doi: 10.1016/j.cmpb.2010.03.003. [DOI] [PubMed] [Google Scholar]
- 63.Nitta N, Shiina T. Estimation of nonlinear elasticity parameter of tissues by ultrasound. Jpn J Appl Phys. 2002 May;41:3572–2578. [Google Scholar]
- 64.Amador C, Urban MW, Chen S, Greenleaf JF. Shear-wave dispersion ultrasound vibrometry (SDUV) on swine kidney. IEEE Trans Ultrason Ferroelectr Freq Control. 2011;58(12):2608–2619. doi: 10.1109/TUFFC.2011.2124. [DOI] [PMC free article] [PubMed] [Google Scholar]
- 65.Warner L, Yin M, Ehman RL, Lerman LO. Kidney stiffness measured in an animal model of unilateral renal arterial stenosis using 2D MR elastography. Proc Int Society for Magnetic Resonance in Medicine. 2009:406. [Google Scholar]
- 66.Fahey BJ, Nightingale KR, McAleavey SA, Palmeri ML, Wolf PD, Trahey GE. Acoustic radiation force impulse imaging of myocardial radio-frequency ablation: Initial in vivo results. IEEE Trans Ultrason Ferroelectr Freq Control. 2005 Apr;52:631–641. doi: 10.1109/tuffc.2005.1428046. [DOI] [PubMed] [Google Scholar]


