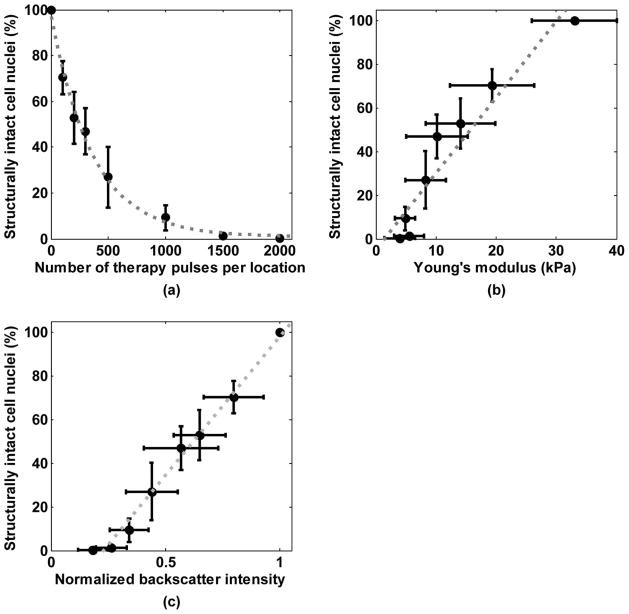
Fig. 10.
(a) Percentage of structurally intact cell nuclei remaining in the treated area decreased exponentially with increasing numbers of pulses. Each data point represents the mean ± standard deviation from 8 independent treatments. The dashed line represents the exponential fit with the number of therapy pulses centered at zero mean and scaled to unit standard deviation, i.e., y = 0.14 · e−1.98·((x − 700)/729) + 0.01, R2 = 0.99. (b) Correlation between the percentage of the remaining structurally intact cell nuclei and the Young’s modulus. The dashed line represents the linear fit, y = 0.03 · x − 0.05, R2 = 0.91. (c) Correlation between the percentage of the remaining structurally intact cell nuclei and the normalized backscatter intensity. The dashed line represents the linear fit, y = 1.27 · x − 0.29, R2 = 0.99.

