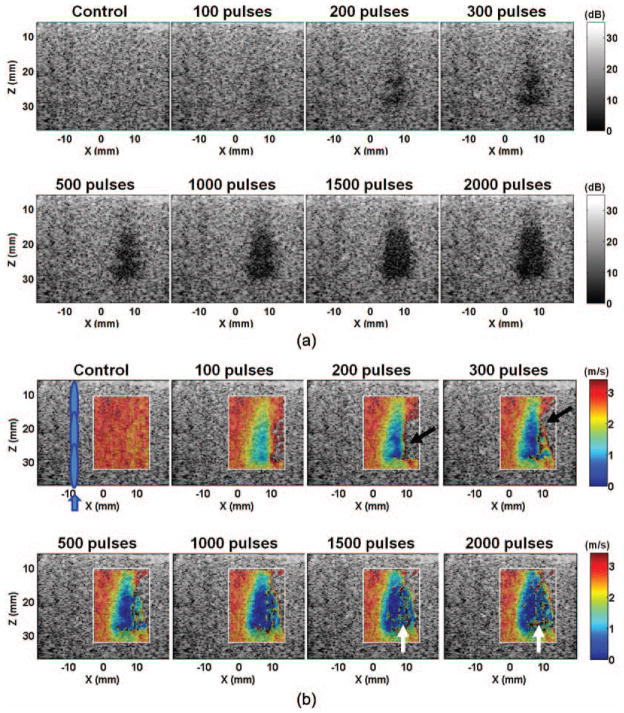
Fig. 3.
(a) B-mode and (b) shear wave velocity images of a representative lesion produced in the agar-graphite phantoms with increasing numbers of therapy pulses per treatment location. The treated volume became increasingly hypoechoic. Correspondingly, the shear wave velocity decreased in the treated volume. The lesions were more easily detected on the elastography than on the B-mode when small numbers of therapy pulses were applied (e.g., 100 pulses/location). The shear wave velocity in some areas opposite the push region (e.g., the areas indicated by black arrows) could not be measured. Noticeable noise was also present in the far end of the lesion (e.g., the areas indicated with the white arrows). These likely occurred because the shear waves were unable to propagate far into a significantly fractionated volume.

