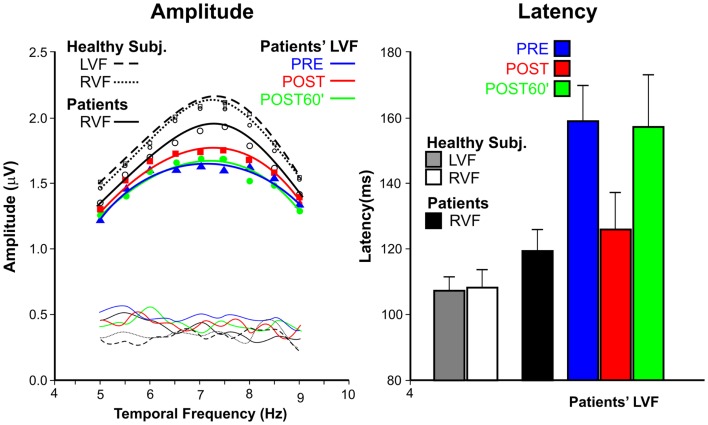
Figure 3.
Steady-state visual-evoked potential data. Left panel: amplitudes as function of temporal frequencies for patients with spatial neglect and healthy subjects. For patients, the LVF responses are reported in PRE, POST, and POST60′ conditions. Thin lines without symbols represent the noise levels. Right panel: apparent latencies; as for amplitude, the data are reported in the three tested conditions.

