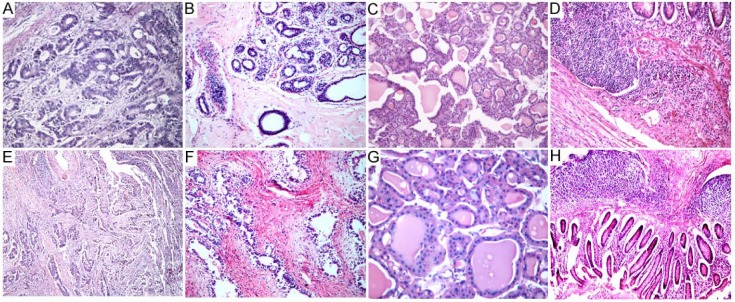
Figure 1.

Routine HE staining analysis.
Human tissue samples of colorectal cancer (A, E), breast adenofibroma (B, F), thyroid gland (C, G), and vermiform appendix (D, H) were processed with xylene (upper panel) or SBO (lower panel) and subjected to HE staining. Representative staining results are shown. A–C, F, 200 ×; D, E, H, 100 ×; G, 400 ×.
