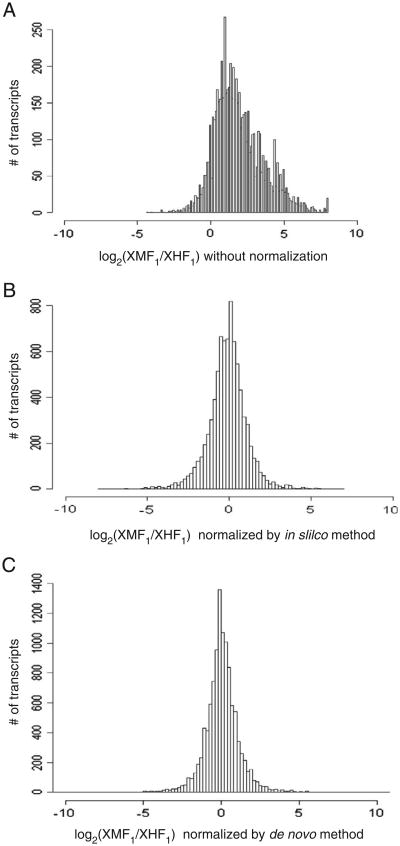
Fig. 2.
Allele distribution in F1 hybrid genetic background. The x-axis is the log2 ratio of the number of reads carrying the X. maculatus allele vs. the number of reads carrying the X. hellerii allele. A value of zero indicates an equal distribution of the two alleles while a positive value indicates stronger X. maculatus allele expression than the X. hellerii allele; the reverse balance in expression is indicated by a negative value. (A) F1 hybrid reads are mapped to only X. maculatus reference transcriptome. (B) F1 hybrid reads are mapped to X. maculatus and in silico X. hellerii transcriptomes allowing five mismatches. (C) F1 hybrid reads are mapped to de novo fused assemblies of both X. maculatus and X. hellerii transcriptomes allowing no mismatches.

