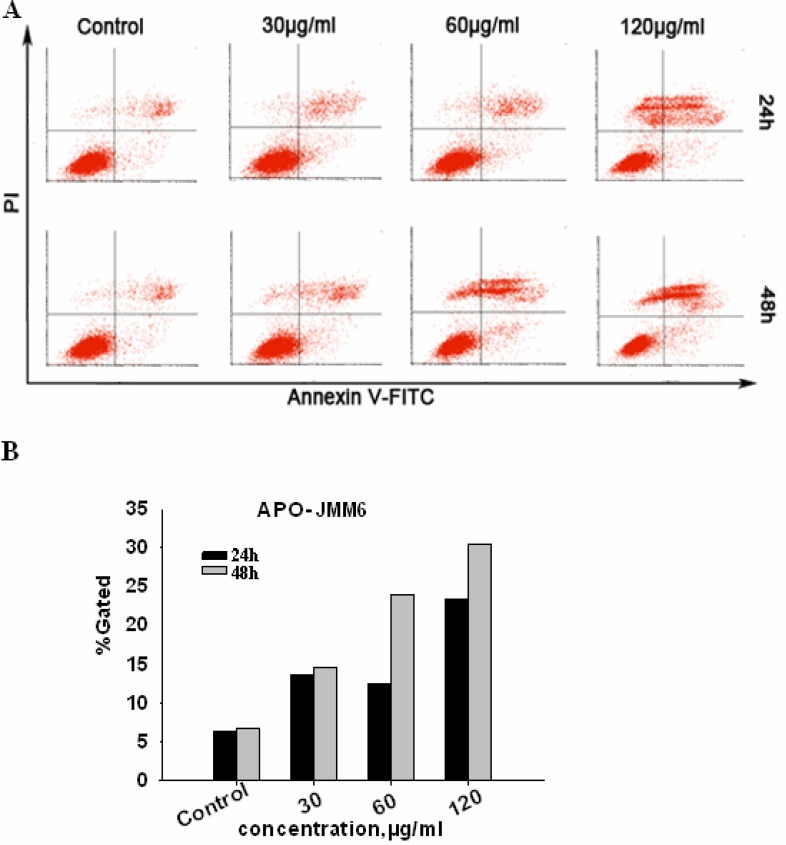
Figure 5.
Cells were incubated with JMM6 for 24h, 48h. and subjected to Annexin V-FITC/PI staining, and analyzed by flow cytometry. (A) Distribution map of cell apoptosis. (B) Bar graph of cell apoptosis. Abscissa denotes the different doses of JMM6, ordinate denotes the cell apoptosis positive rate.

