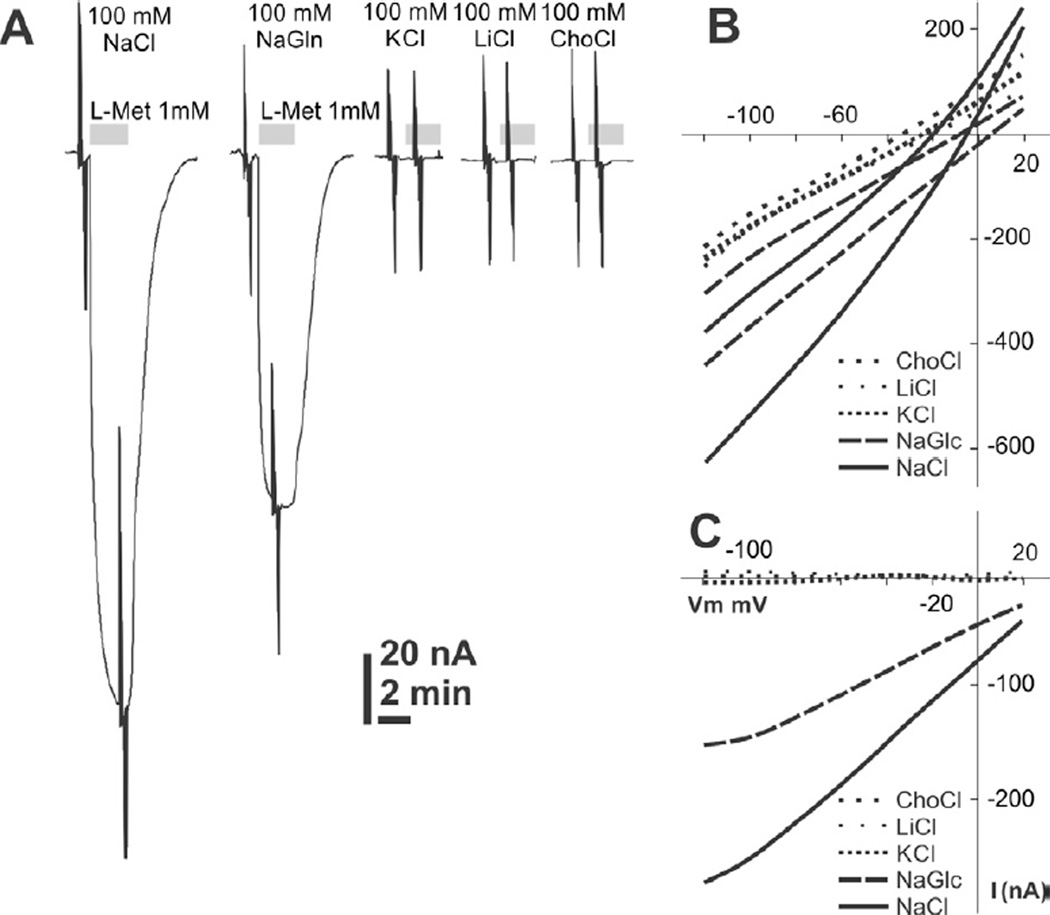
Figure 4. Current voltage relationship and ion dependency of AeNAT5.
A. 1 mM L-Met induced currents in AeNAT5 expressing oocytes perfused with different ion composition solutions. Gray bars indicate L-Met application episode. The major salts used for the solutions are shown above the traces. Spikes are actual ramp stimulations that were used to build current-voltage relationship (IV) plots shown in panels B and C. B. Representative current/voltage profile of an AeNAT5 expressing oocyte. Different line patterns depict different ion compositions in the perfused media (see legend on the plot insert). The pairs of identical lines represent current in the presence and absence of 1 mM L-Met C. IV characteristics of AeNAT5 built by subtraction of substrate-independent current component from 1 mM L-Met induced currents.

