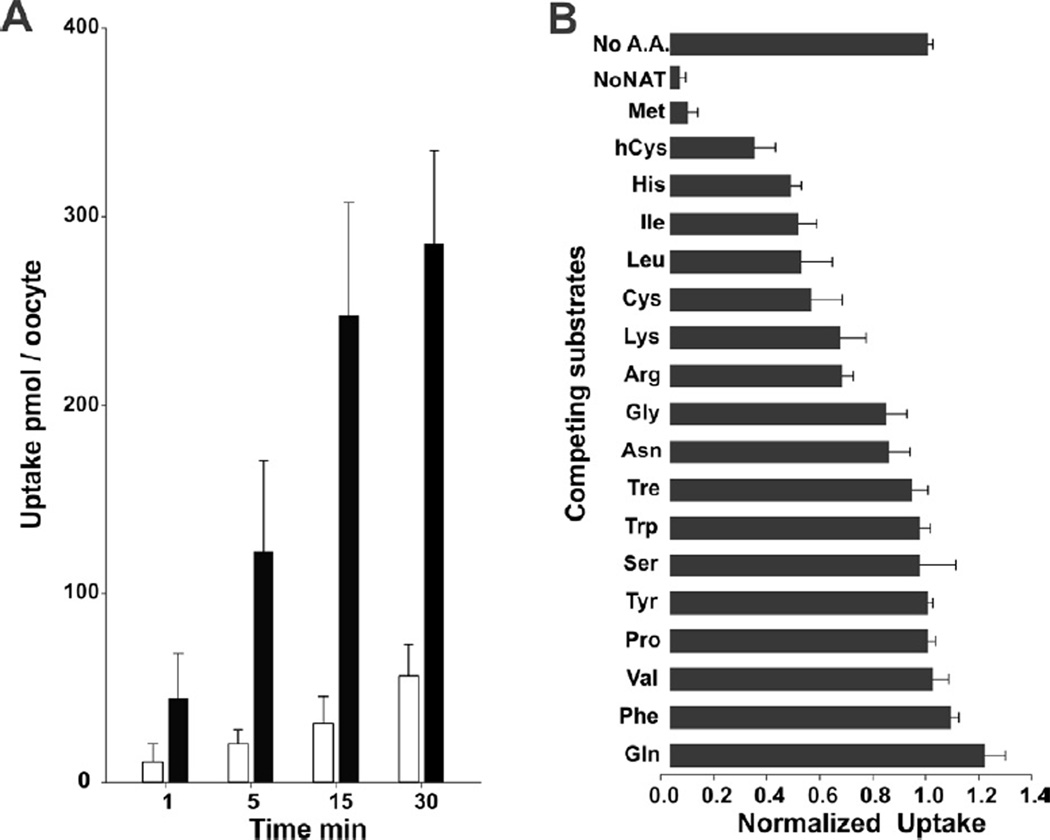
Figure 6. L-Methionine uptake and selectivity of AeNAT5.
A. Time courses of 3H L-Met uptake in AeNAT5 and DW - injected oocytes are shown as black and empty bars, respectively. B. Cis-inhibition of 3H L-met uptake by competing L-amino acids and DL-homocysteine. Bars are normalized mean quantities of the radiolabeled substrate absorbed during 15 min by AeNAT5 - expressing oocytes that were bathed in ND98 with 1:100 diluted stock of radiolabeled L-Met and 5 mmol l−1 of specified amino acids. No A.A. bar represents positive control, 3H L-Met uptake in AeNAT5 expressing oocytes without competing amino acid added; and No NAT represents negative control, 3H L-Met uptake in DW - injected oocytes. Error bars are standard deviation values for n ≥ 3 oocytes.

