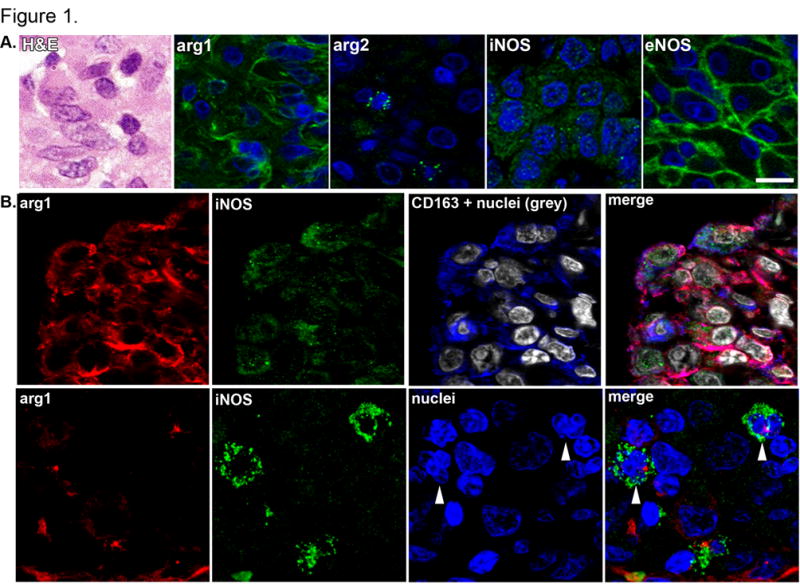
Figure 1. Immunohistochemical identification of arginase and NOS isoforms in cells from cynomolgus macaque granulomas.

A. Epithelioid macrophages, as depicted by hematoxylin and eosin staining (H&E) were stained for Arg1, Arg2, iNOS and eNOS (green) and nuclei (blue) and imaged at 600x magnification to represent the unique staining patterns associated with each enzyme. Each panel presents an independent set of epithelioid macrophages in the macrophage region, scale bar represents 20 μm. B. Co-expression of Arg1 (red) and iNOS (green) in CD163+ macrophages (blue, top panel) and in cells with segmented neutrophil-like nuclei (arrowheads, bottom panel). Image acquired at 600x magnification, scale bar represents 20 μm.
