
Figure. 3. Macrophage phenotypes and distribution in non-necrotic granulomas from macaques with active TB.
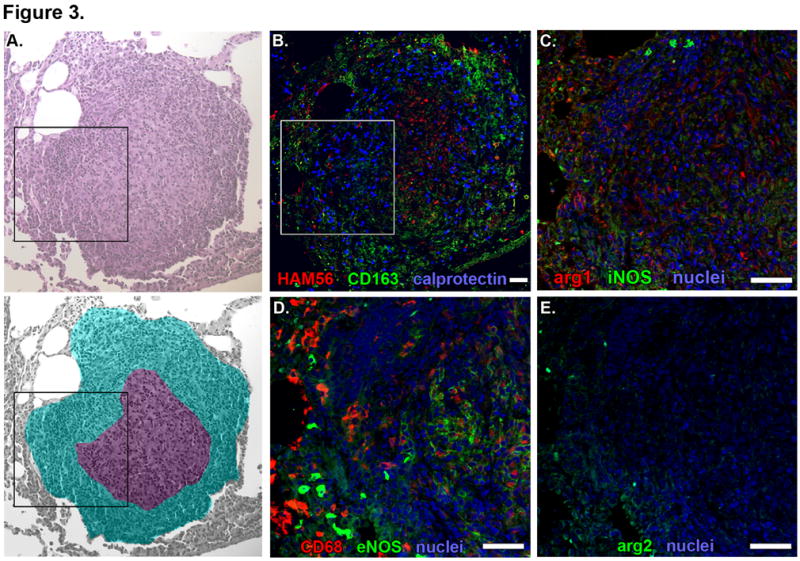
Individual panels show serial 5-μm thick sections of a representative non-necrotic granuloma. A. Hematolylin and eosin staining (top) with a pseudocolored representation (bottom) indicating lymphocyte-rich (cyan) and epithelioid macrophage-rich (purple) regions. Black box indicates the region depicted at higher magnification in images C-E. B. Macrophage-specific stains including HAM56 (red), CD163 (green) and calprotectin-stained neutrophils (blue). White box indicates the region depicted at higher magnification in images C-E. C. iNOS (green) and Arg1 (red) expression with nuclei (blue). D. CD68 (red) and eNOS (green) expression with nuclei (blue). E. Arg2 (green) expression with nuclei (blue). Scale bars represent 100 μm.