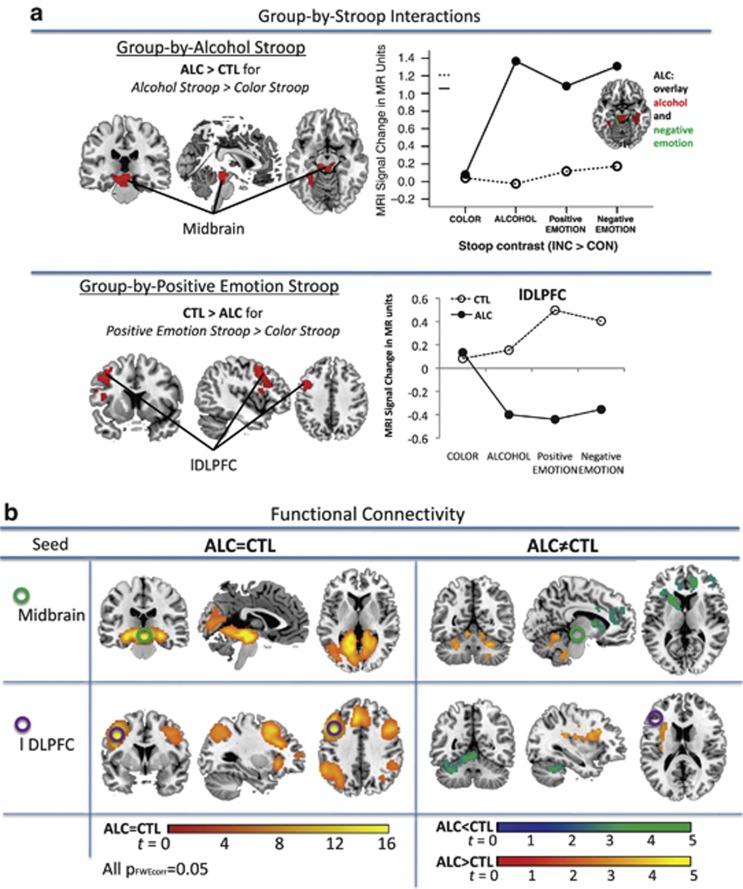
Figure 2.
Functional magnetic resonance imaging (fMRI): (a) Group-by-Stroop interaction showing that alcoholics (ALC) activated midbrain and parahippocampal brain regions more than CTL when processing alcohol Stroop (Alc>CON) relative to color Stroop (INC>CON), and (lower panel) CTL activated dorsolateral prefrontal cortex (DLPFC) regions more than ALC when processing positive-emotion Stroop (Emo+>CON) relative to color Stroop (INC>CON). Graphs illustrating MRI signal change in the midbrain-hippocampal (upper panel) and left DLPFC clusters (lower panel) in ALC and CTL for color Stroop, alcohol Stroop, positive-emotion Stroop, and negative-emotion Stroop. (b) fcMRI: Seed-to-voxel synchronous activation for the midbrain seed (upper panel) and the DLPFC seed (lower panel) for group similarities (left) and group differences (right).

