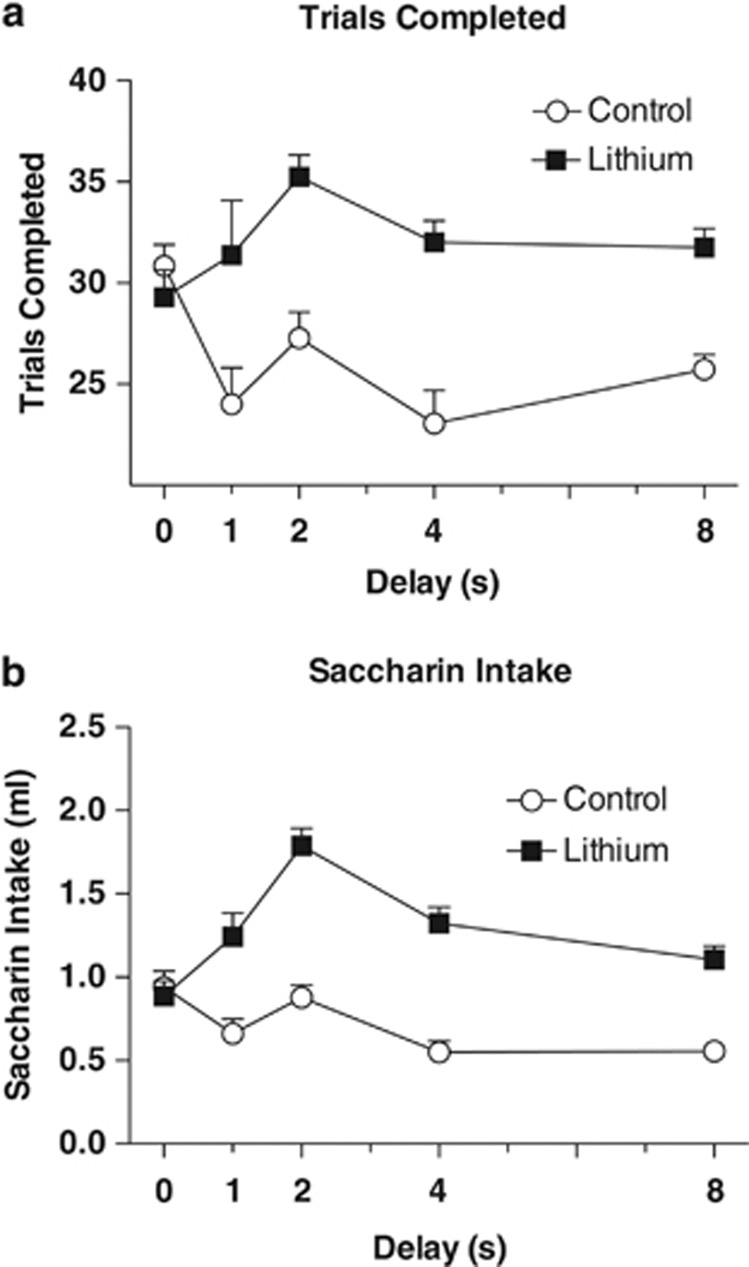
Figure 3.
(a) Group mean number of trials completed per session±SEM as a function of delay (0, 1, 2, 4, and 8 s). Mice in the lithium group completed a greater number of trials per session than the control group, P<0.001. (b) Volume of saccharin solution consumed per session as a function of delay (0, 1, 2, 4 and 8 s) was also higher in the lithium group, P<0.001.

