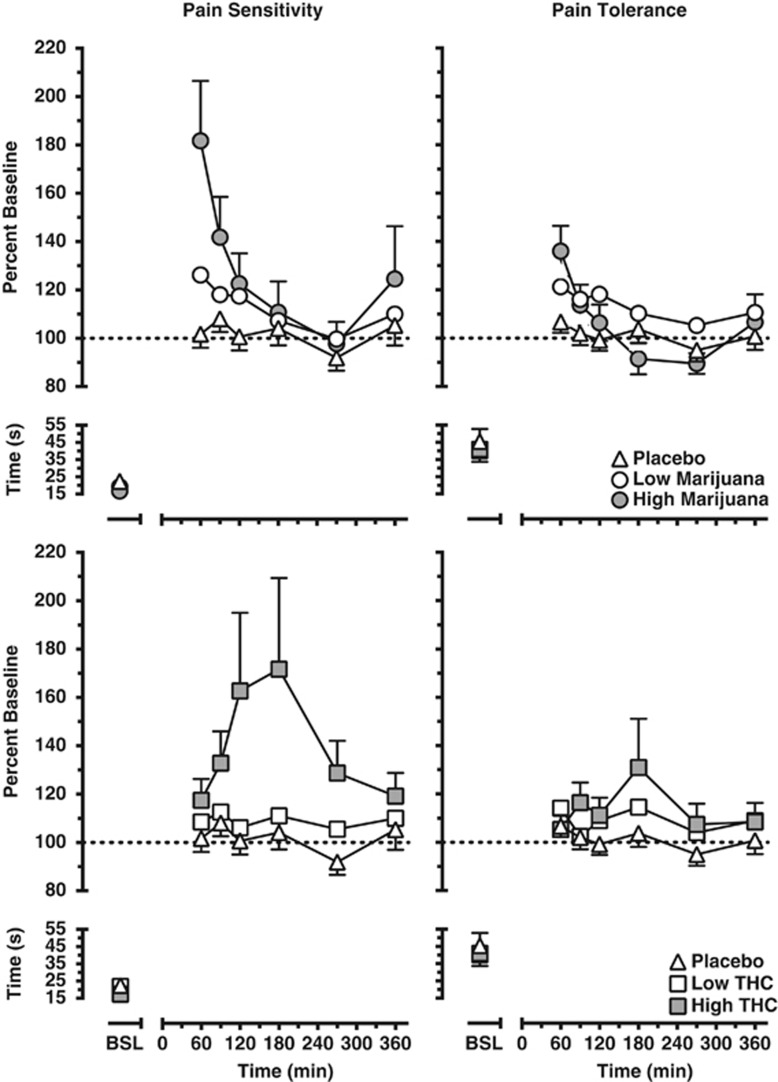
Figure 1.
Pain sensitivity (left panels) and tolerance (right panels) as calculated by percent baseline latency (seconds) to report pain and withdraw the hand from the cold water. Data are presented as mean values for the group according to marijuana strength (top panels) or dronabinol dose (bottom panels) and time point. Refer to the Results section for explanation of significant differences between drug conditions.

