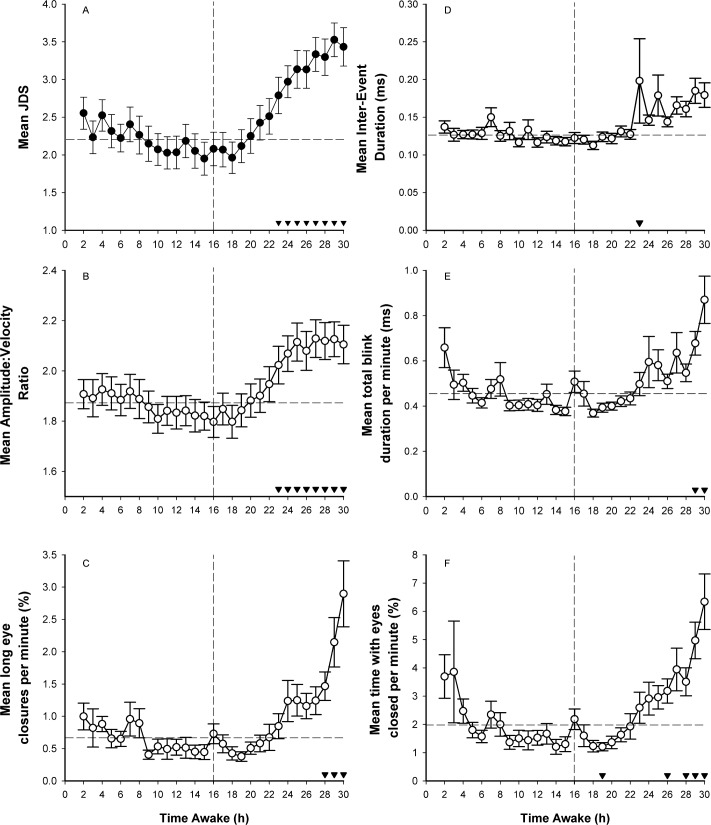
Figure 1. Mean hourly ocular outcomes as a function of hours awake.
Following a main effect of time (p < 0.0001), post hoc tests with Bonferroni-Holm corrections comparing hourly bins to the average of the first 16 h awake are shown (▼ p < 0.05/k-1). Vertical line represents 16 h of wakefulness. Post hoc comparisons were made for each hourly bin after 16 h awake compared to the average value in the first 16 h, as represented by the horizontal line. Means ± SE are shown for (A) JDS, n = 392; (B) amplitude-velocity ratio, n = 392; (C) long eye closures per minute, n = 385; (D) inter-event duration, n = 392; (E) total blink duration per minute, n = 391; and (F) time with eyes closed per minute, n = 391.

