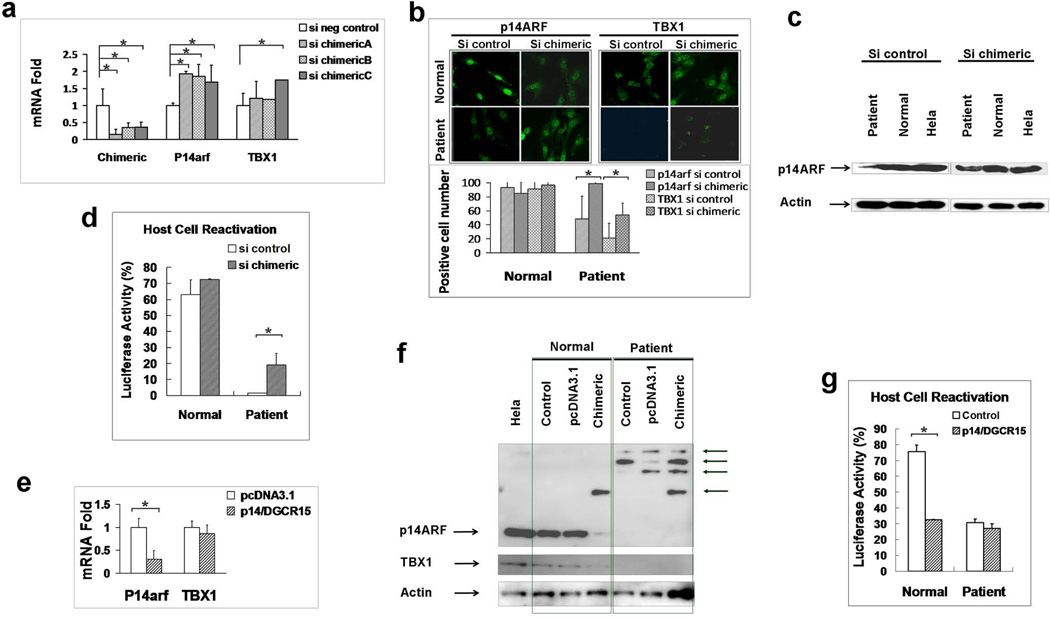
Figure 6.
Functional analysis of p14ARF-FAM230A (a) Knockdown of p14ARF-FAM230A by siRNA. Reduced expression of p14ARF-FAM230A RNA levels in DD129BE cells by 63.5–84.3% by use of 3 different siRNA’s targeted to the chimeric p14ARF-FAM230A (left graph) associated with increased levels of expression of p14ARF (middle graph) and TBX1 (right graph) in DD129BE cells. (b) p14ARF (left) and TBX1 (right) protein levels detected by immunofluorescence and numbers of positive cells (bottom) before and after p14ARF-FAM230A siRNA treatment. (c) Reduced p14ARF protein levels in patient lymphoblasts (left) was increased by knock down of p14ARF-FAM230A (right). (d) HCR assay showing increased post-UV DNA repair capability after treatment of patient cells with p14ARF-FAM230A siRNA. (e) Reduced mRNA expression of p14ARF in normal cells by transfection of the chimeric p14ARFFAM230A. (f) Reduced protein expression of p14ARF and TBX1 in normal cells by transfection of the chimeric p14ARF-FAM230A. The extra protein bands in patient cells were indicated by arrows. (g) Impaired post-UV DNA repair capability in normal cells by transfection of the chimeric p14ARF-FAM230A. (a, b, d, e and g) mean±s.d., n≥3. *P≤0.05.

