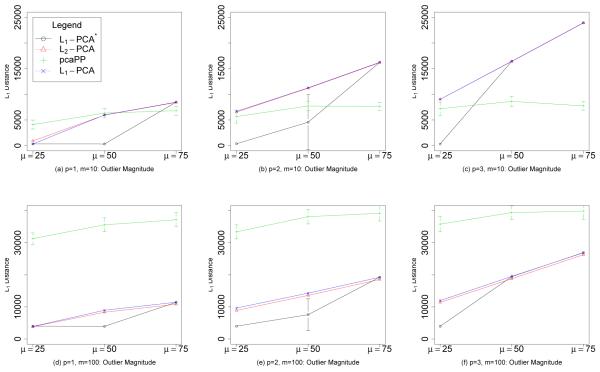
Figure 8.
Gaussian noise. The sum of errors, the sum of L1 distances of projected points in a 2-dimensional subspace to the “true” 2-dimensional subspace of the data, versus outlier magnitude with Gaussian noise, for dimensions m = 10 and m = 100, and p = 1, 2, 3. The average sum of errors over 100 iterations is plotted. Error bars represent one standard deviation. The parameter p is the number of outlier-contaminated dimensions.

