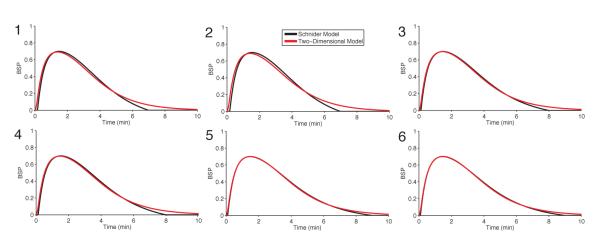
Figure 7. System identification of the parameters for the 2-dimensional model of propofol.

The experiments simulate the Schnider model for propofol in response to bolus administration of 3.5 mg kg−1 for each patient. Patient 1, a 30 year-old, 180 cm 70 kg man; Patient 2, a 30 year-old 150 cm, 50 kg woman; Patient 3, a 40 year-old 170 cm 90 kg man; Patient 4, a 40 year-old, 165 cm, 60 kg woman; Patient 5, a 50 year-old 196 cm 100 kg man; and Patient 6, a 50 year-old 175 cm 80 kg woman. The black curves are the BSP time courses simulated from the four-dimensional Schnider model and the red curves are non-linear least-squares fits of the two-compartment model approximations in 1. The parameter estimates are given in Table 2.
