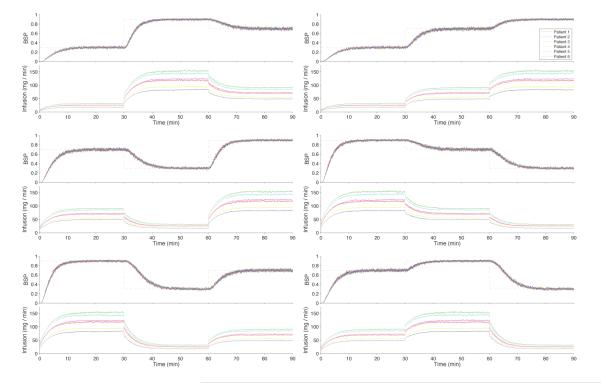
Figure 9. BSP control performance in simulated human patients using propofol.
The control targets are 3! = 6 different sequences of the BSP levels 0.3, 0.7 and 0.9 (dashed lines BSP subpanels) with each level maintained for 30 minutes. Each of the 6 patients (Table 2) must achieve control of each of the 6 target trajectories. In each panel, the upper subpanel shows the time course of the BSP control output, x2,k∣k and the lower subpanel shows the infusion rates, uk∣k required to achieve the control output. The BSP time courses and the infusion rates are: red for Patient 1; dark blue for Patient 2; light blue for Patient 3; yellow for Patient 4; green for Patient 5; and purple for Patient 6.

