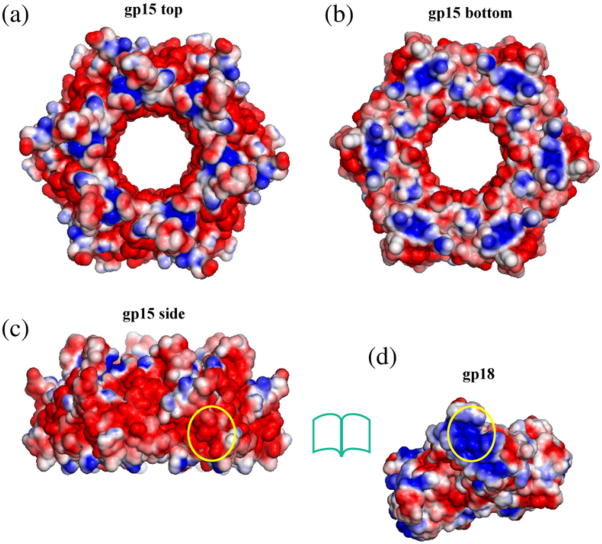
Fig. 3.
Solvent-accessible surfaces of gp15 and gp18 colored according to the electrostatic potential. The blue color corresponds to a potential of 2 kT/e. The red color corresponds to a potential of -2 kT/e. (a), (b), and (c) represent the top, bottom, and side views of the gp15 hexamer, respectively. One region on the side of the gp15 hexamer that faces gp18 in the contracted tail is outlinedby the yellow oval. (d) shows the surface of the gp18 model. The region of the gp18 molecule that faces gp15 in the contracted tail is outlined by the yellow oval. The electrostatic potential was calculated using the APBS software31 and visualized with PyMOL.64

