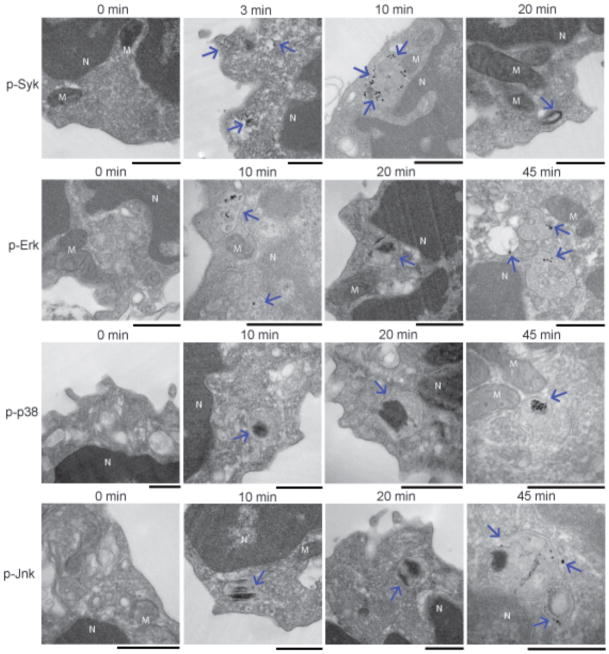
Figure 4. TEM images of the temporal and spatial distribution of the phosphorylation of kinases in the BCR signaling pathway.
Mouse splenic B cells were incubated with anti-IgM for the indicated times, fixed, permeabilized and stained with antibodies specific for p-Syk, p-Erk, p-p38 and p-Jnk followed by HRP-conjugated secondary antibodies and developed with DAB. Dense black areas shown by arrows represent p-kinases. Scale bars represent 500 nm. Mitochondria are denoted by ‘M’ and ‘N’ denotes nucleus. Images are taken from 10–15 grids examined for each time point.

