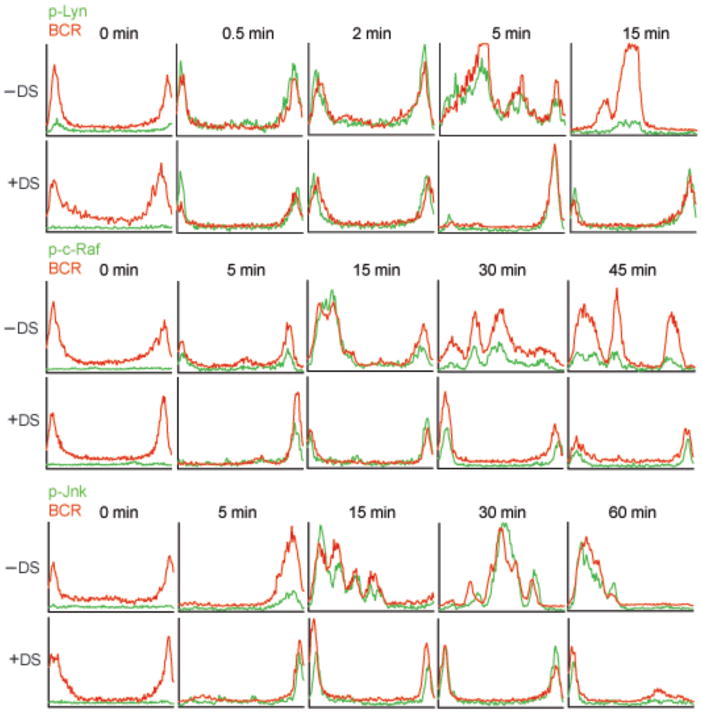
Figure 6. The subcellular distribution of p-kinases in dynasore-treated B cells.
Mouse splenic B cells were incubated with dynasore in DMSO or in DMSO alone in RPMI. At 0 min cells were fixed, permeabilized and stained with Cy5-anti-IgM to detect the BCR and antibodies specific for p-Lyn, p-c-Raf, or p-JNK followed by Alexa 488-conjugated secondary antibodies. Alternatively cells were incubated with dynasore in DMSO or DMSO alone in RPMI with Cy5-anti-IgM for the indicated times. Cells were fixed, permeabilized and stained with Ab specific for p-Lyn, p-c-Raf or p-Jnk followed by Alexa 488-conjugated secondary antibodies. Approximately 80 cells were analyzed in five different experiments and the intensity analyses of Alexa 488 (green) and Cy5 (red) across the representative cells shown in Supplementary Fig. 4 are given. The x-axis represents a distance of approximately 6 μm and the y-axis represents the fluorescent intensities of Alexa-488 (green) and Cy5 (red) from 0 to 4095 on a 12-bit scale.

