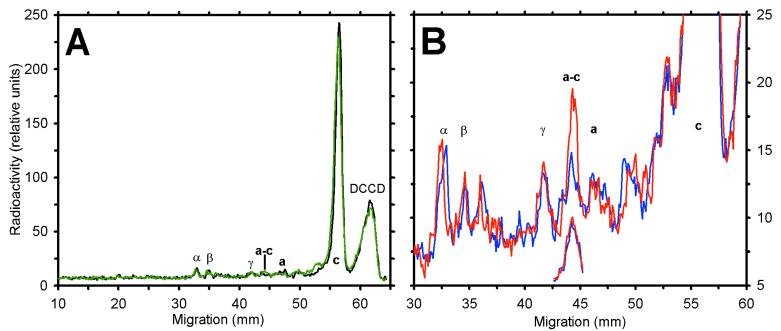
Figure 3.
Distribution of incorporated 14C from SDS/PAGE analysis of [14C]DCCD-treated aN214C/cM65C-membranes. A membrane sample (1 mg protein/ml) was incubated for 2 h with 10 μM [14C]DCCD, resulting in 72% inhibition of ATPase activity. Aliquots were diluted and exposed to different conditions for 3 min, then incubated alone or with 50 μM I2 for 10 min. Each aliquot then was denatured in the presence of 5 mM NEM and analyzed by nonreducing SDS/PAGE. The dried gel was exposed to a storage phosphor screen for ≈6 days. Shown are the profiles of radioactivity in sample lanes after scanning the phosphor screen. Locations of FOF1 subunits are noted. (A) Nonoxidized (black) and oxidized (green) controls. The peak at the migration front (labeled DCCD), represents [14C]DCCD that hydrolyzed or reacted with a buffer component. (B) Comparison of aliquots exposed to 4 mM ADP/Pi (blue) or 4 mM ATP (red) before oxidation. The offset, partial traces show the radiolabel in the a–c band for a sample treated with 100 μM [14C]DCCD for 0.5 h before the nucleotide incubation and oxidation steps noted above. The scale for the offset traces is about 3-fold greater than that shown on the y axis.

