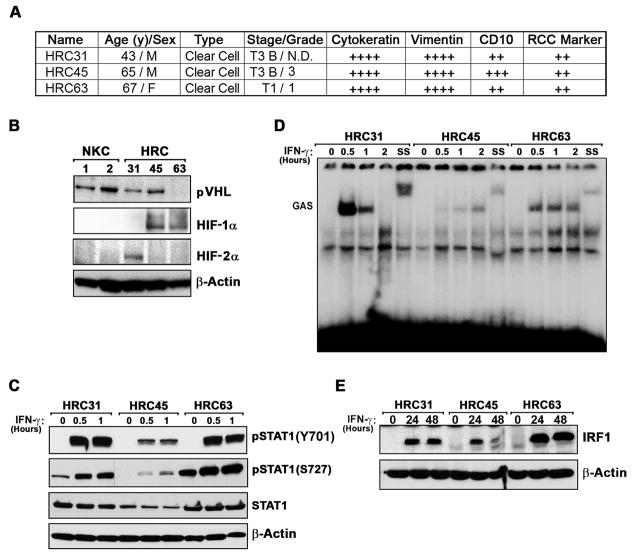
Figure 1. Characterization of ccRCC cell lines.
(A) Three FCCC patient-derived ccRCC cell lines, designated HRC31, HRC45 and HRC63, were histologically analyzed by staining with anti-pan-cytokeratin, anti-vimentin, anti-CD10 and anti-RCC marker antibodies. Staining was arbitrarily graded as weak (+), moderate (++), strong (+++), or very strong (++++) in at least 80% of individual cells in a representative field. (B) Whole-cell extracts from HRC cell lines were examined for pVHL, HIF-1α, and HIF-2α expression by immunoblotting. As normal controls, extracts from two populations of cultured kidney epithelial cells (NKC1 and NKC2) were used. (C) Whole-cell extracts from HRC cell lines were examined for phospho-STAT1 Y701, pSTAT1 S727, or total STAT1 after IFN-γ (100U/ml) treatment. (D) Kinetics of STAT1 binding to a GAS element were examined by EMSA of nuclear lysates from HRC cells. SS = supershift with an anti-STAT1 antibody. (E) Induction of the ISG product IRF-1 following treatment of HRC cell lines by IFN-γ (100U/ml) was determined by immunoblotting.

