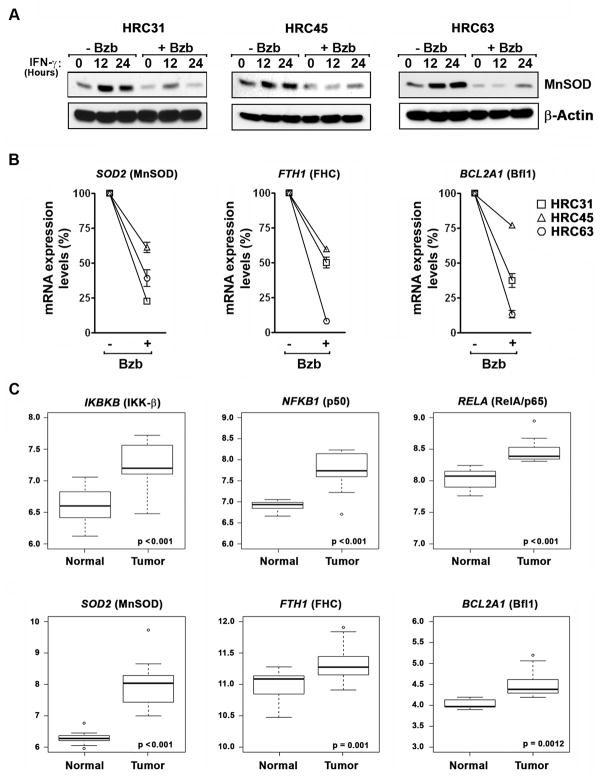
Figure 5. . NF-κB pro-survival targets are down-regulated by bortezomib and show elevated expression in ccRCC tumors.
(A) Immunoblot analysis of MnSOD protein expression in HRC cell lines after exposure to IFN-γ (100U/ml) in the presence or absence of bortezomib (5μM). (B) mRNA expression levels of SOD2, BCL2A1, and FTH1 after bortezomib (5 μM, 12h) treatment of HRC cell lines, compared to untreated samples (arbitrarily set to 100% in each cell line), after normalization to an internal GAPDH control. Error bars represent mean +/− S.D, n=3. (C) Box plots showing gene expression profiles of NF-κB signaling components (upper panels) or downstream survival targets (lower panels) in paired normal and tumor samples from 21 ccRCC patients (44). Y-axis displays the Robust Multi-array Average (RMA)- normalized expression level (on log2 scale) of each mRNA. Open circles represent outliers in that particular comparison. The solid line within each box is the median, and distance between box and whiskers indicate interquartile ranges.

