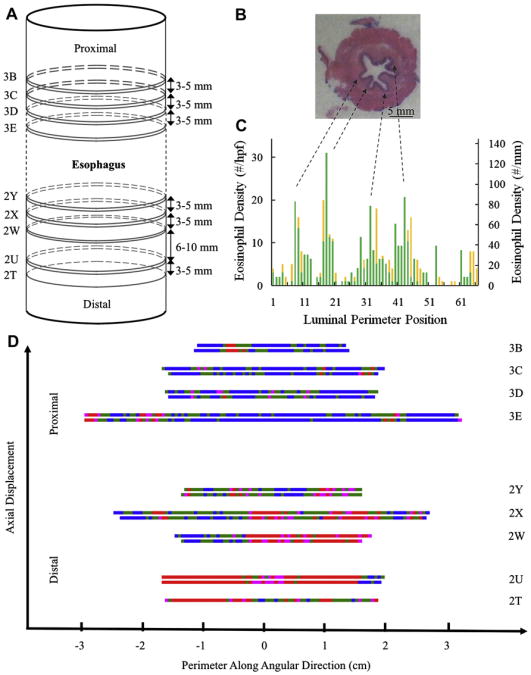
Fig 1.
Histology, mapping, and data analysis. A, Sequential ordering of sections within the esophagectomy. B, Digital image of representative hematoxylin and eosin–stained esophageal section 3D. C, Representative eosinophil density as a function of luminal perimeter position for section 3D. D, Eosinophil density map as a function of both luminal perimeter and axial location at 3 eosinophils/hpf or less (blue), 4 to 14 eosinophils/hpf (green), 15 to 19 eosinophils/hpf (pink), and 20 eosinophils/hpf or greater (red).

