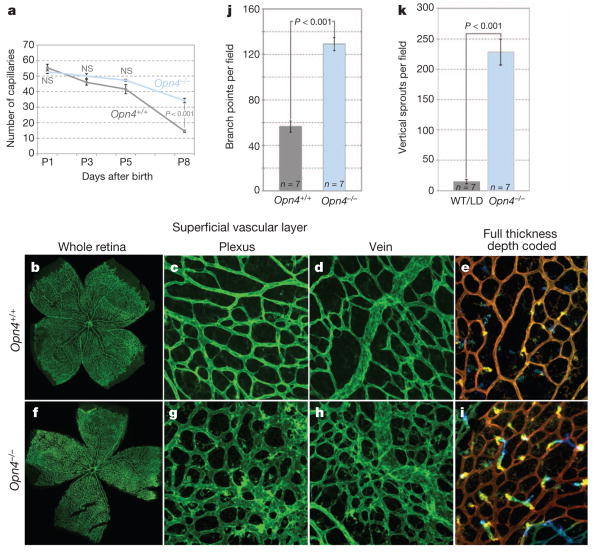
Figure 2. |Hyaloid regression and retinal angiogenesis are regulated by melanopsin.
a, Quantification of hyaloid vessels in Opn4+/+ and Opn4−/− mice over a P1 to P8 time course. P values obtained by ANOVA. b–i, Low (×100; b, f) and high (×200; c–e, g–i) magnification images of isolectin-labelled P8 retina from wild-type (b–e) and Opn4−/− (f–i) pups raised in normal lighting.e, i, Depth-coded z stack images for wild type (e) and Opn4−/− (i) indicate the appearance of vertical angiogenic sprouts. j, k, Graphs show quantification of branch points (j) and vertical sprouts (k) in animals of the indicated genotypes. WT, wild type. P values obtained by Student's t-test. Errors bars are s.e.m. Sample sizes (n) as labelled.

