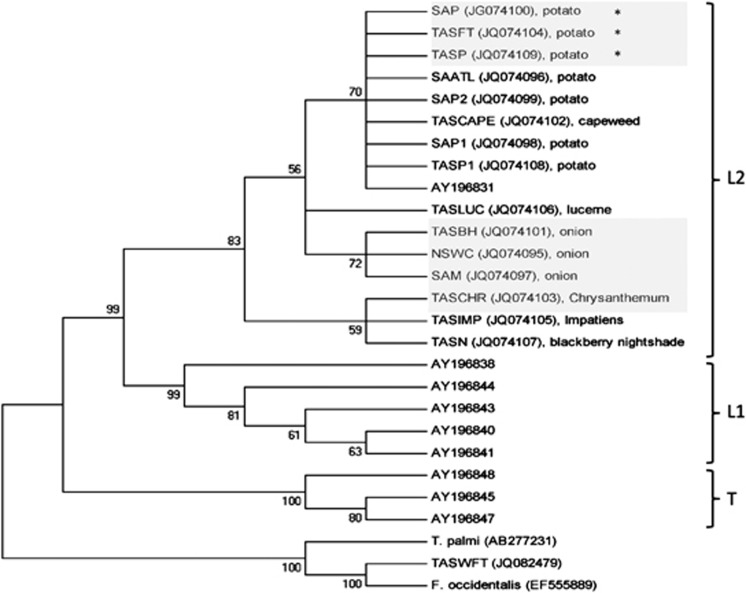
Figure 2.
Phylogenetic analysis (The evolutionary history was inferred using the Maximum Likelihood method based on the Tamura-Nei model (Tamura and Nei, 1993). The bootstrap consensus tree inferred from 1000 replicates (Felsenstein, 1985) is taken to represent the evolutionary history of the taxa analysed (Felsenstein, 1985). The percentage of replicate trees in which the associated taxa clustered together in the bootstrap test (1000 replicates) are shown next to the branches (Felsenstein, 1985). Initial tree(s) for the heuristic search were obtained automatically as follows: when the number of common sites was <100 or less than one fourth of the total number of sites, the maximum parsimony method was used; otherwise BIONJ method with MCL distance matrix was used. The analysis involved 27 nucleotide sequences. Codon positions included were 1st+2nd+3rd+Noncoding. All positions containing gaps and missing data were eliminated. There were a total of 433 positions in the final dataset. Evolutionary analyses were conducted in MEGA5 (Tamura et al., 2011).) of all T. tabaci populations collected from Australia (Genbank: JQ074095-JQ074109), selected sequences of T. tabaci from Europe (Genbank: AY196831, AY196838, AY196840, AY196841, AY196843, AY196844, AY196845, AY196847, AY196848), T. palmi (GenBank AB277231), F. occidentalis from the United States (GenBank EF555889) and F. occidentalis from Tasmania (Genbank: JQ082479). Clades are marked as per Brunner et al. (2004). Greyed out populations were tested for vector competence. *known TSWV-vector competent populations.

