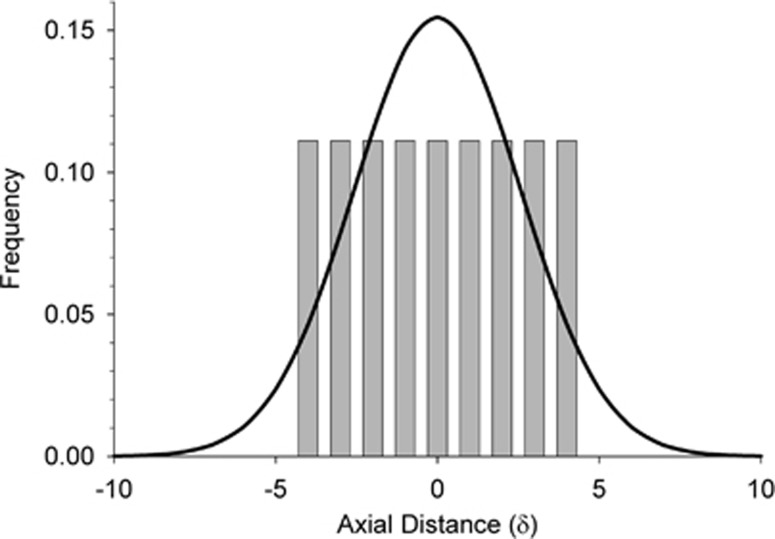
Figure A1.
Distribution of axial dispersal distances (along the horizontal or vertical axis) for Wright's neighborhood model (curved line, assuming a normal distribution of dispersal) and our model (vertical bars) with BW81. In both models, the density of individuals (D)=1 and mean and variance of parent–offspring dispersal are  and σ2=0.667, respectively.

