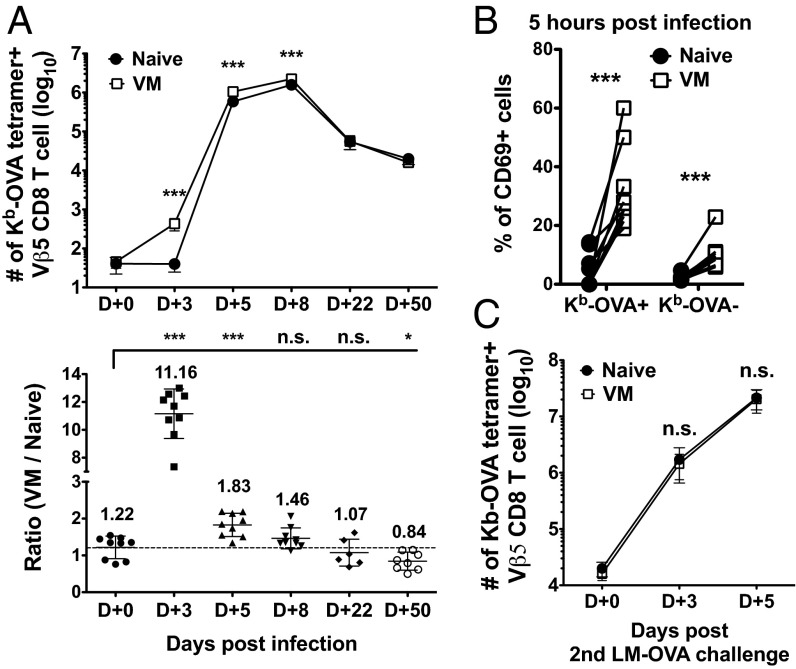
Fig. 2.
VM CD8 T cells outcompete their naïve counterparts during the expansion phase of the primary immune response. (A) At the indicated time points following LM-OVA infection, Ova/Kb tetramer+ cells derived from VM and naïve Vβ5 donors in the spleen and superficial lymph nodes were enumerated. Data are shown as absolute numbers or ratio between VM and naïve derived cells. (B) The frequency of CD69 expressing Ova/Kb-tetramer + or Ova/Kb-tetramer− Vβ5 CD8 T cells was determined 5 h after L. monocytogenes-OVA infection. Data show CD69 expression by paired samples of naïve and VM cells in the same recipients. (C) Number of Ova/Kb-specific VM and naïve Vβ5 CD8 T cells during secondary immune respond against LM-OVA. For all experiments, the data are compiled from three independent experiments except day 22 p.i. (A), which were derived from two independent experiments (six mice total). Line graphs show mean ± SD and statistical significance is indicated (***P < 0.001; *P < 0.05; NS, not significant, is used to denote P values >0.05, Student t test).

