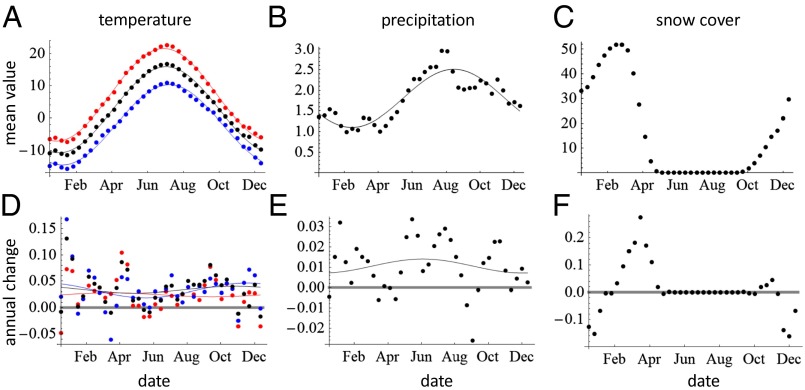
Fig. 1.
Seasonal patterns of temperature, precipitation, and snow cover. The upper panels (A–C) show averages over the study period, and the lower panels (D–F) show the mean annual change (the slope of linear regression for climatic variable vs. year) for temperature (°C; A and D), precipitation (mm/day; B, E), and snow cover (cm; C, F). For temperature, black corresponds to daily mean, blue to daily minimum, and red to daily maximum. All data averaged over 10-d periods. The lines show periodic regressions. To measure the rate of thermal change in the units of days, we examined the time derivative of the periodic regression line for mean temperature (A). We defined the mean date of spring and the mean date of autumn as the times at which the derivative was minimized and maximized, respectively. We computed the change in spring (autumn) temperature by averaging the slope (D) during the period of 0.3 y centered at the mean date of spring and autumn, yielding 0.027 °C and 0.039 °C, respectively. Given the rate at which spring and autumn advance (slope of periodic regression, 0.23 °C per day for both), the changes in temperature correspond to the shifts of −0.12 and 0.17 d/y for spring and autumn, respectively.

