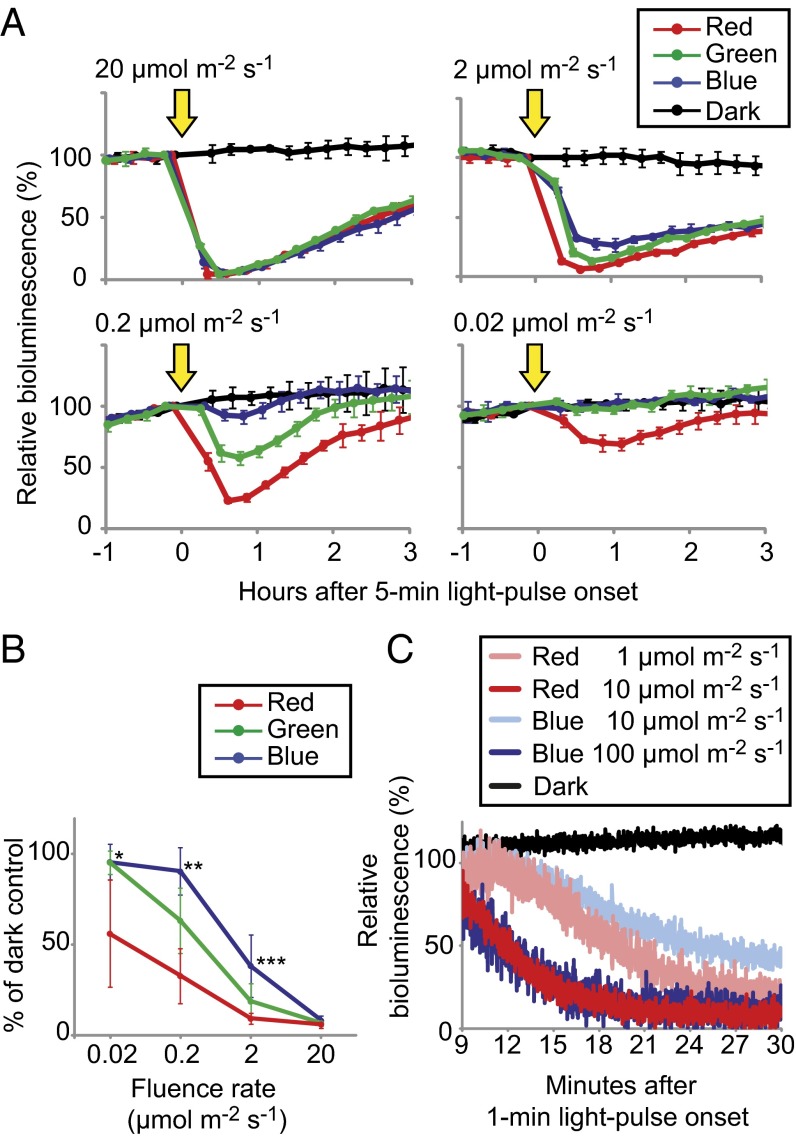
Fig. 2.
The effects of light pulses of different wavelengths on ROC15-LUC reporter activity. Asynchronous Tris-acetate-phosphate cultures (19) of the ROC15-LUC reporter strain were transferred to black 24-well plates and exposed to darkness for 9 h to induce bioluminescence of the reporter. (A) Representative data of responses to light pulses (arrows) by blue, green, and red LEDs. Fluence rates are indicated in the graph. The value just before the light pulse was normalized to 100. Each point represents the mean ± SD of the normalized bioluminescence traces from three independent cultures. (B) Fluence rate response of ROC15-LUC bioluminescence. Data shown are the mean ± SD of values relative to the dark controls (% of dark control) at the bottom of the bioluminescence traces after light pulse from two to five independent experiments of two transgenic lines. Asterisks indicate significant changes: *red vs. green and blue (Student t test; P < 0.01); **red vs. green and blue (P < 0.01) and green vs. blue (P < 0.05); ***red vs. blue (P < 0.05). (C) Detailed time courses of the bioluminescence decline after exposure to light pulses. Bioluminescence was monitored every second after a 1-min light-pulse with blue or red LEDs. The value just before the light pulse was normalized to 100 (not shown).

