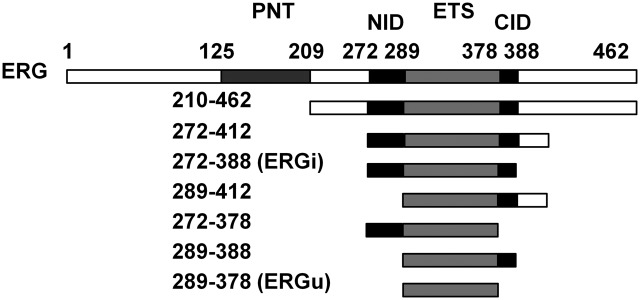
Fig. 1.
ERG protein constructs and ITC DNA-binding measurements. The seven truncation constructs of ERG are shown with corresponding residues numbered. The Ets DNA-binding domain common to all constructs is illustrated in light gray, flanked by the N- and C-terminal autoinhibitory domains in black. The PNT domain is shown in dark gray.

