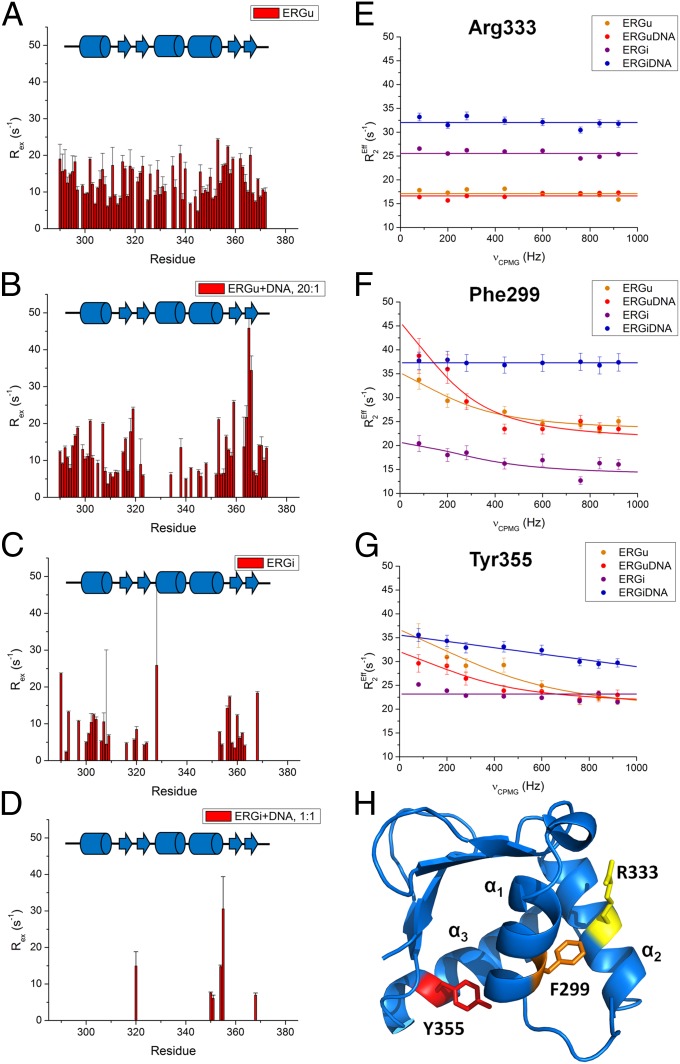
Fig. 5.
Relaxation dispersion plots for the Ets domain of ERGu, ERGi, and the ERGi:DNA complex. (A–D) Exchange values (REx) and the corresponding residues in ERGu, ERGu:DNA (20:1), ERGi, and the ERGi:DNA complex, respectively, recorded at 18.8 T. (D–F) Representative relaxation dispersion profiles for residues in ERG. (E) Arg333 is located in a region of the protein that does not show exchange in any of our ERG constructs and is illustrated here as a control. (F) Phe299 packs near the core of the AID and shows dispersion in the ERGu and ERGi constructs, but not when ERGi is bound to DNA. (G) Tyr355 lies on DNA-binding helix α3 and shows dispersion in unbound ERGu, but limited or no dispersion in DNA-bound or free ERGi, respectively. (H) Cartoon representation of our ERGu structure. Key residues described in E–G are highlighted in yellow (Arg333), orange (Phe299), and red (Tyr355).

