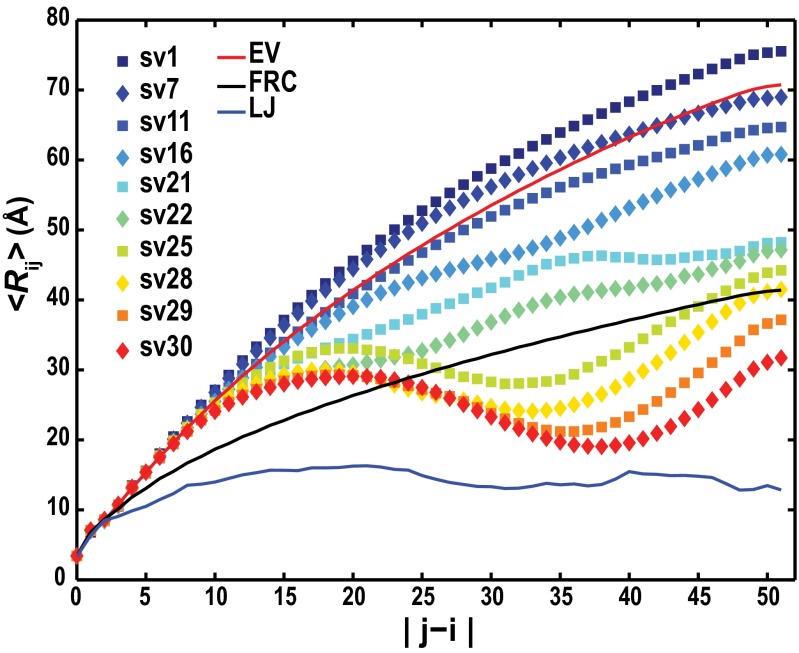
Fig. 3.
<Rij> profiles for sequence variants of the (Glu-Lys)25 system. The red curve denotes the profile expected for (Glu-Lys)25 polymers in the EV limit. The black curve is expected for an FRC, and the solid blue curve is obtained when (Glu-Lys)25 polymers form maximally compact globules. For compact globules, <Rij> plateaus to a value that is prescribed by their densities.

