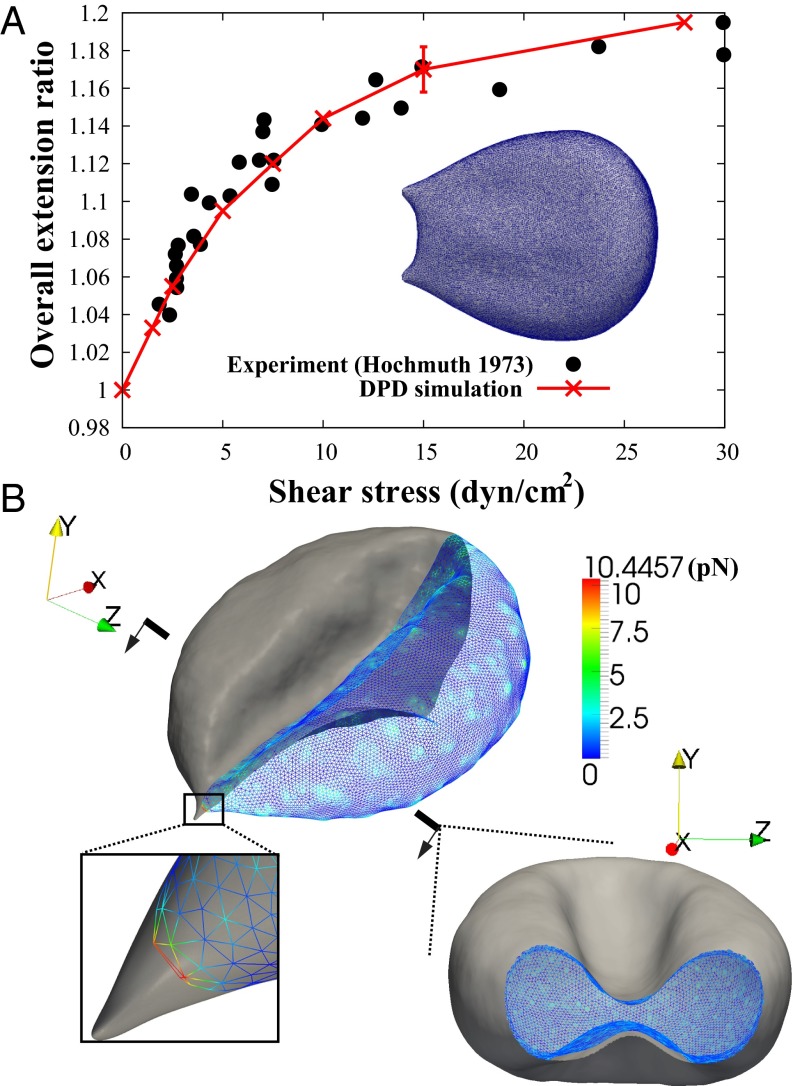
Fig. 4.
Bilayer–cytoskeletal detachment in channel flow. (A) Comparison of cell extension ratio between the DPD simulation and the experiment for the whole-cell stretching with a line attachment (18). The error bars are obtained by increasing or decreasing the default value of shear modulus  by 10%. (B) Simulation of the bilayer–cytoskeletal detachment in channel flow. Inset shows the local view of the bilayer–cytoskeletal interaction near the attachment point. The bilayer is shown as a gray surface and the cytoskeleton is shown as a triangular network with the contour. The contour is the magnitude of the bilayer–cytoskeletal interaction force on a junctional complex. The unit of force is pico-Newtons (pN).

