Fig. 3.
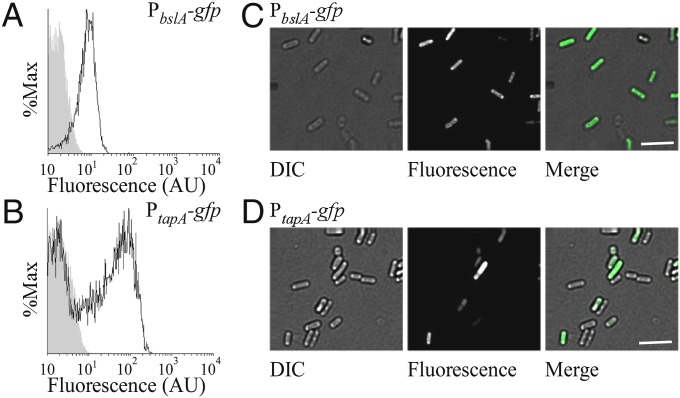
Analysis of bslA expression by cells forming complex colonies. (A and B) Flow cytometry analysis of expression of (A) bslA (NRS2289; 3610, sacA::PbslA-gfp) and (B) tapA-sipW-tasA (NRS2394; 3610, sacA::PtapA-gfp) in cells isolated from complex colonies after 18 h of growth at 37 °C. The gray-shaded zone represents the fluorescence observed for wild-type NCIB3610 containing no gfp. (C and D) Single-cell microscopy of cells isolated from complex colonies carrying either the (C) PbslA-gfp (NRS2289) or (D) PtapA-gfp (NRS2394) transcriptional reporters. (Scale bars, 10 µm.)

