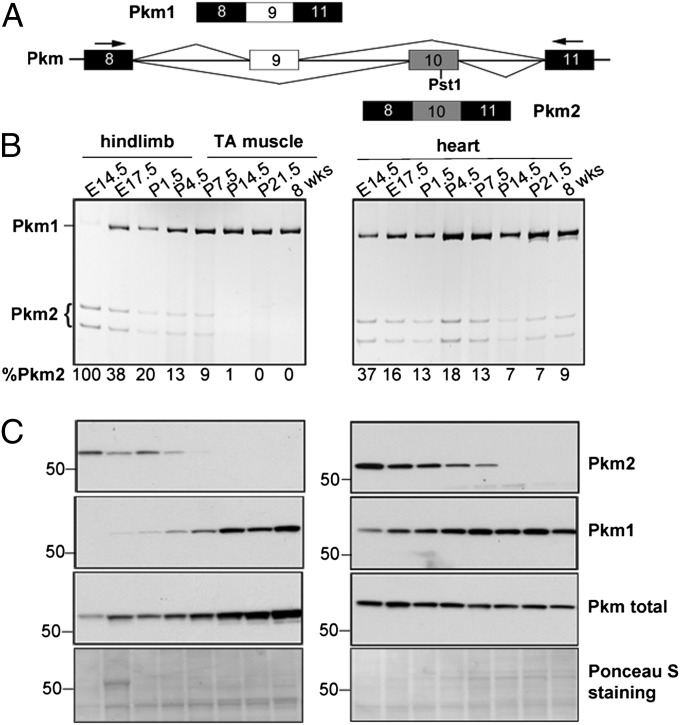
Fig. 1.
Pkm alternative splicing during mouse skeletal muscle and heart development. (A) Diagram of the mouse Pkm genomic segment indicating mutually exclusive splicing of exons 9 and 10. Constitutive exons are in black; alternative exons are in white (exon 9) or gray (exon 10). Primers used to amplify the Pkm variable region and the PstI recognition site in exon 10 are indicated. (B) RT-PCR analysis of Pkm mRNA from the indicated developmental stages of mouse skeletal muscle (Left) and heart (Right). PCR products were digested with PstI. Splicing is quantified as percent of the Pkm2 isoform (%Pkm2). (C) Western blot analysis using antibodies recognizing Pkm2, Pkm1, or both (Pkm total) isoforms. Ponceau S-stained blots are shown as loading controls.

