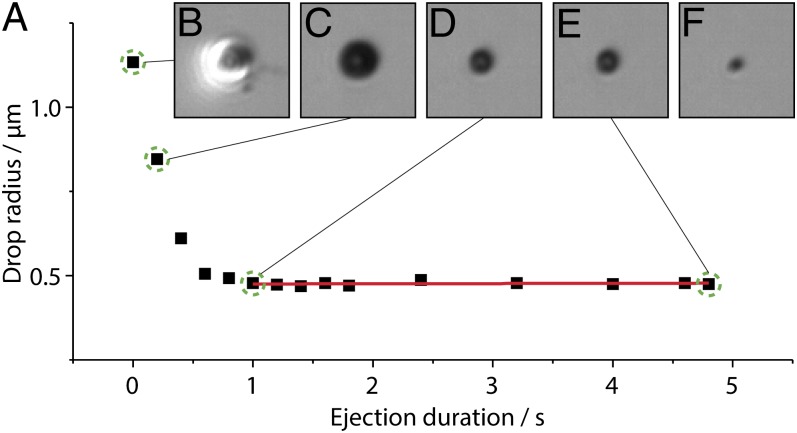
Fig. 2.
Experimental observation of active sessile drop stabilization. (A) Radius of an actively stabilized sessile DPnB droplet. Different phases of drop formation are indicated with green dashed circles in A and illustrated by optical micrographs, showing the drop after (B) 0, (C) 0.2, (D) 1, and (E) 4.8 s. (F) The last micrograph shows the dried solid content, 80 ms after ejection termination. The applied voltage was 250 V.

