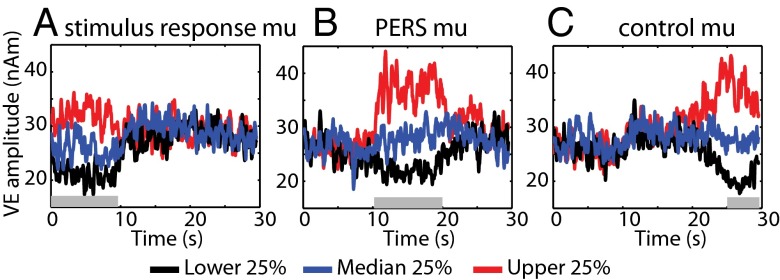
Fig. 1.
Group average of the Hilbert envelope of virtual electrode mu time course for each quartile according to sorting single trials by the average mu power during stimulus response (0–9.5 s; A), PERS (10.5–20 s; B), and control (24.5–29.5 s; C) time windows. Colored lines denote lower (black), median (blue), and upper (red) quartiles. Gray shaded bars denote the duration of the sorting window.

