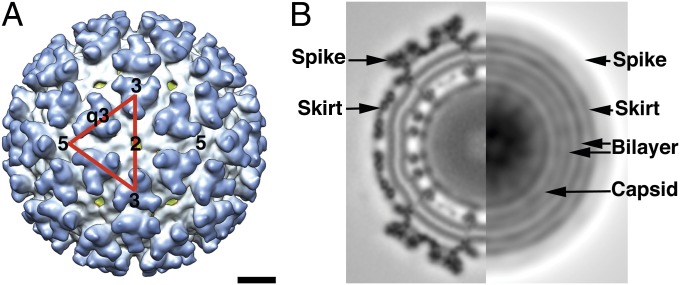
Fig. 1.
Cryo-EM reconstruction map of SINV at pH 6.4. (A) The 14.5-Å-resolution reconstruction map of SINV at pH 6.4. An icosahedral asymmetric unit of the virus is shown as a red triangle, with the positions of the 5-, 3-, 2-, and q3-fold axes denoted by numbers. The map is color-coded such that the viral membrane is green, the skirt is white, and the spike is blue. The scale bar is 100 Å, applicable to both A and B. (B) Central cross-section of the reconstruction map (Left) and a rotationally averaged projection image (Right) showing the layered features of the protein shells and the viral membrane (labeled). The rotationally averaged image was computed from the model projections at 2° angular intervals within one asymmetric unit (37).

