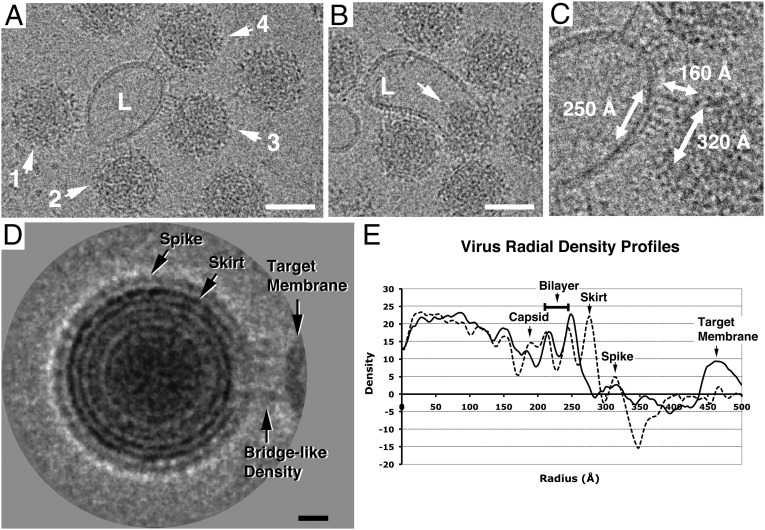
Fig. 2.
Cryo-EM images of acidified SINV–liposome complexes (pH 6.4). (A) Image showing bridge-like densities spanning between SINV particles (labeled 1–4) and a liposome (L). Scale bar is 500 Å. (B) Image showing a SINV particle likely fused with a liposome (L). The arrow indicates its released capsid core. Scale bar is 500 Å. (C) Enlarged view and dimensions of the virus–liposome interaction site (particle 3 in A). (D) Two-dimensional average of the images of the SINV–liposome complex. Note that the ring of the skirt is broken at the liposome-binding site. Scale bar is 100 Å. (E) Virus radial density profiles derived from the image shown in D. Measurements were made from the center of the virus in the 3 o’clock (solid line) and 9 o’clock (dashed line) directions.

