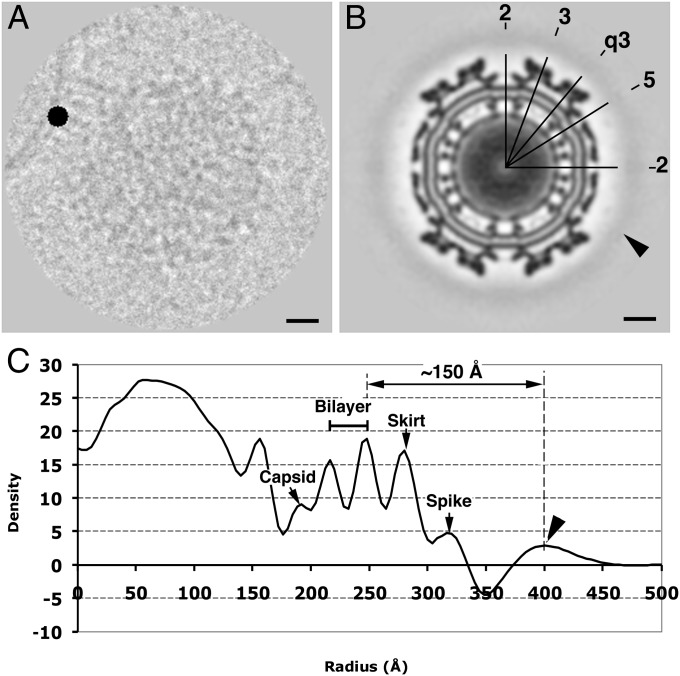
Fig. 3.
Reconstruction of masked SINV–liposome complex images. (A) An exemplary image showing a high-intensity disk of 64 Å in diameter situated on the target membrane. (B) Cross-section of the icosahedral reconstruction map. The arrowhead indicates the smeared density shell surrounding the virus surface. The numbers represent the icosahedral 5-, 3-, 2-, and q3-fold axes. (C) Radial density profile of the reconstruction map showing the position and thickness of the extra density shell. The arrowhead indicates the peak of the density shell introduced by the black disk. Scale bars in A and B are 100 Å.

