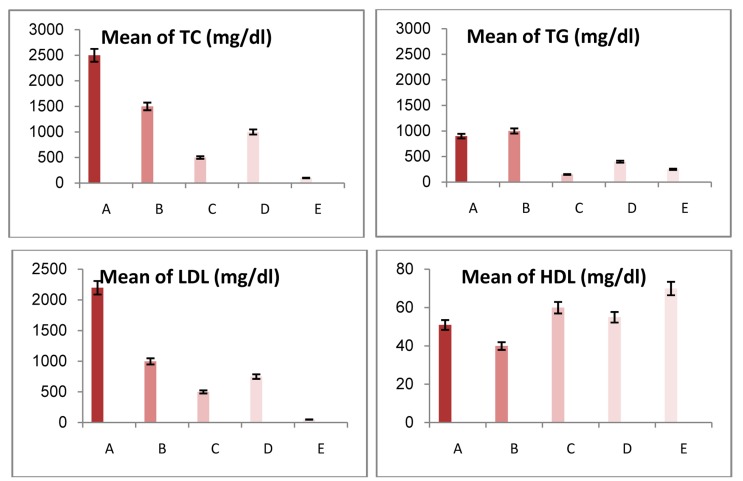
Figure 1.
Lipid profile changes in the blood plasma in different groups A: High-cholesterol diet group; B: Control group after stopping high-cholesterol diet; C: Quince group; D: Atorvastatin group; E: Normal diet group TC: Total cholesterol, TG: Triglyceride, LDL: Low density lipoprotein, HDL: High density lipoprotein

