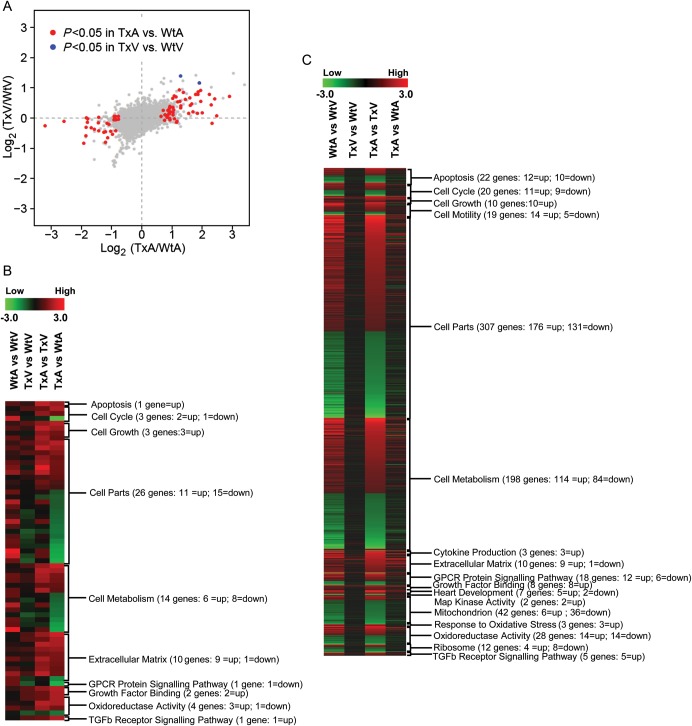
Figure 4.
Results of the mRNA micro-array experiments in the TGF-β1 transgenic mice. (A) Scatter plot of estimated log ratios of gene expression from the TxA vs. WtA comparison (X-axis) are plotted against those from the TxV vs. WtV comparison (Y-axis). Differentially expressed genes having adjusted P-values (Bonferroni correction) < 0.05 are highlighted in red (atria) or blue (ventricle). Between the two experimental factors, chambers (atria and ventricle) and TGF-β1 genotypes (Tx and Wt), an overwhelming majority display a larger TGF-β1 induced expression fold change in the atria (red points) compared with the ventricle (blue points). (b–d) Gene expression patterns in atria and ventricles of Wt and Tx mice. Each column represents the results from duplicate hybridizations, as follows: WtA vs. WtV; TxV vs. WtV; TxA vs. TxV; TxA vs. WtA. Normalized data values depicted in shades of red and green represent elevated and repressed expression, respectively. (B) Grouping of genes showing the significant difference in the TxA vs. WtA comparison. (C) Grouping of genes showing significant differences in the TxA vs. TxV comparison. (D) Representative genes important in the TGF-β1 signalling cascade and fibrosis. Differentially expressed genes having adjusted P-values (Bonferroni correction) < 0.05 are highlighted in red or green.

