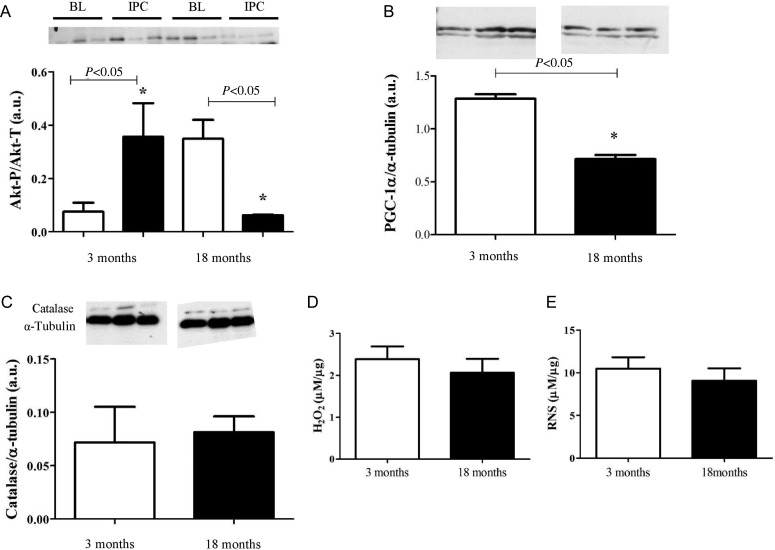
Figure 8.
Key signalling proteins in the non-diabetic heart are differentially expressed and activated in the aging, non-diabetic heart. (A) Phosphorylation of Akt increases with age in the non-diabetic heart, with a decrease in activation following IPC. White bars represent samples taken at baseline (BL), black bars represent samples taken following three cycles of IPC. Values determined by densitometry of Akt phosphorylation (Akt-P) corrected to respective α-tubulin over the relative expression of Akt-total (Akt-T) corrected to respective α-tubulin. Data are shown as mean ± SEM, n = 3 per group. One-way ANOVA and Tukey's post hoc analysis were used for statistical analysis. (B) PGC-1α expression decreased with age. However, no changes in catalase expression or hydrogen peroxide (H2O2) or RNS were seen with age in the non-diabetic heart (C–E). Data are shown as mean ± SEM, n = 4 per group. Student's t-test was used for statistical analysis.

